
Last week showcased Wall Street’s remarkable resilience as major indices posted solid gains despite significant headwinds. The SPY (S&P 500) climbed 1.12% for the week, while both QQQ (NASDAQ) and DIA (Dow Jones) delivered similar returns at 1.21% and 1.13% respectively. This performance helped cap off September as one of the strongest months for equities in recent memory.
The most significant development was the U.S. government shutdown that began on October 1, after Congress failed to pass funding. There have been multiple shutdowns since 1980. In the past, shutdowns have often caused short-term market volatility but little long-term damage. This shutdown is somewhat more disruptive because it has halted the release of major economic data. The September jobs report, which had been scheduled for Friday, was delayed. As a result, investors and the Federal Reserve lack the latest labor market data that they normally use to guide policy decisions.
Markets have stayed near record levels despite the ongoing uncertainty. Recent gains have been supported largely by expectations of Federal Reserve interest rate cuts, alongside continued confidence in corporate earnings. According to the CME FedWatch tool, investors were assigning about a 96% probability of a 25-basis-point cut at the Fed’s October 29–30 meeting.
Looking ahead, October has historically been one of the most volatile months for equities, with average market turbulence running about one-third higher than in other months. The market’s ability to maintain momentum may depend in part on how quickly the government shutdown is resolved, since reopening would allow the release of key economic data.
Note: The reports noted as tentative may be delayed or not released due to the ongoing government shutdown. This includes last week’s reports that were not published.
📅 Wednesday, Oct 8th
- FOMC Meeting Minutes: Markets will parse how officials framed the September 25-basis-point rate cut to a 4.00%–4.25% range and any discussion of further easing. They will also check whether the Summary of Economic Projections still signals an end-2025 median policy rate near 3.6% (about two more quarter-point cuts from current levels).
Expect close read-through on inflation, with core Personal Consumption Expenditures at 2.9% year over year and 0.2% month over month in August after 0.3% in July, any concern about reacceleration, updates on quantitative tightening mechanics (caps of $5 billion in Treasuries and $35 billion in mortgage-backed securities), and how financial conditions and a 4.3% unemployment rate are shaping the Federal Reserve’s reaction function.
📅 Thursday, Oct 9th
- Unemployment Claims (Tentative – Week of Sep 29th): This is the delayed report from the week before due to the government shutdown, heightening anticipation among investors for any surprises upon release. It will draw close scrutiny as it comes amid conflicting signs in the labor market, with the previous reading of 218,000 claims significantly beating expectations of 235,000 and the forecast of 229,000 suggesting a modest uptick.
- Unemployment Claims (Tentative – Week of Oct 6th): The upcoming U.S. weekly unemployment claims report, forecast at 233,000, is expected to show a modest uptick in jobless filings after several weeks of tight labor market conditions. However, it remains uncertain whether the report will be released on schedule. Market participants will be watching closely for any updates.
📅 Friday, Oct 10th
- Average Hourly Earnings m/m (Tentative – Week of Sep 29th): The U.S. Average Hourly Earnings for August is scheduled for release with a consensus forecast of 0.3%, matching the previous reading of 0.3%. Any upside surprise above 0.3% could point to persistent wage inflation and reduce the likelihood of a more dovish Federal Reserve stance. Market participants will also pay close attention to the accompanying labor force data, particularly the unemployment rate, to determine whether stronger wage growth reflects genuinely tight labor market conditions or is merely statistical noise.
- Non-Farm Employment Change (Tentative – Week of Sep 29th): The U.S. Non-Farm Employment Change is expected to show a gain of 52,000 jobs in September, up from the 22,000 increase recorded in August. Market participants should closely watch the average hourly earnings and labor force participation rate, as signs of wage pressures or weak labor supply could sway expectations for rate cuts. Any upside surprise, especially if paired with stronger wage growth, could temper bets on aggressive Federal Reserve easing.
- Unemployment Rate (Tentative – Week of Sep 29th): The U.S. unemployment rate is expected to remain at 4.3%, matching the prior reading. Market participants will scrutinize Non-Farm Payrolls changes by industry, particularly in services and manufacturing. They should also monitor the labor force participation rate, which is hovering near 62.3%, along with average hourly earnings, where sustained 0.3% month-over-month growth would signal sticky wage pressure. Persistent strength in labor data could slow further easing. A surprise rise above 4.3% would strengthen the case for additional rate cuts.
- Prelim UoM Consumer Sentiment: The upcoming report is expected to show a further decline to 54.6 from the previous reading of 55.1, marking another month of deteriorating consumer confidence as Americans continue to grapple with concerns over high prices, labor market uncertainty, and overall economic conditions.
The 54.6 forecast would represent the third consecutive monthly decline, reflecting persistent consumer anxiety over inflation expectations (currently ~4.7%) and growing unemployment concerns, with nearly two-thirds of respondents expecting joblessness to rise over the next year.
Market participants should monitor whether the actual reading meets, beats, or falls short of the 54.6 consensus, as consumer sentiment serves as a leading indicator of consumer spending which accounts for approximately 68% of U.S. GDP, with weaker-than-expected readings potentially signaling reduced discretionary spending and increased market volatility, particularly impacting consumer-dependent sectors like retail, travel, and entertainment.
- Prelim UoM Inflation Expectations: The University of Michigan’s preliminary one-year ahead inflation expectations are forecast at 4.7%, in line with the September reading, highlighting that households still anticipate above-target price pressures. Market participants will be watching whether the October preliminary reading comes in above or below this level. Attention will also be watching the five-year inflation outlook, which was last at 3.7%. Comparing that to the one-year outlook helps show whether consumers believe today’s high prices are temporary or likely to stick around for the long run.
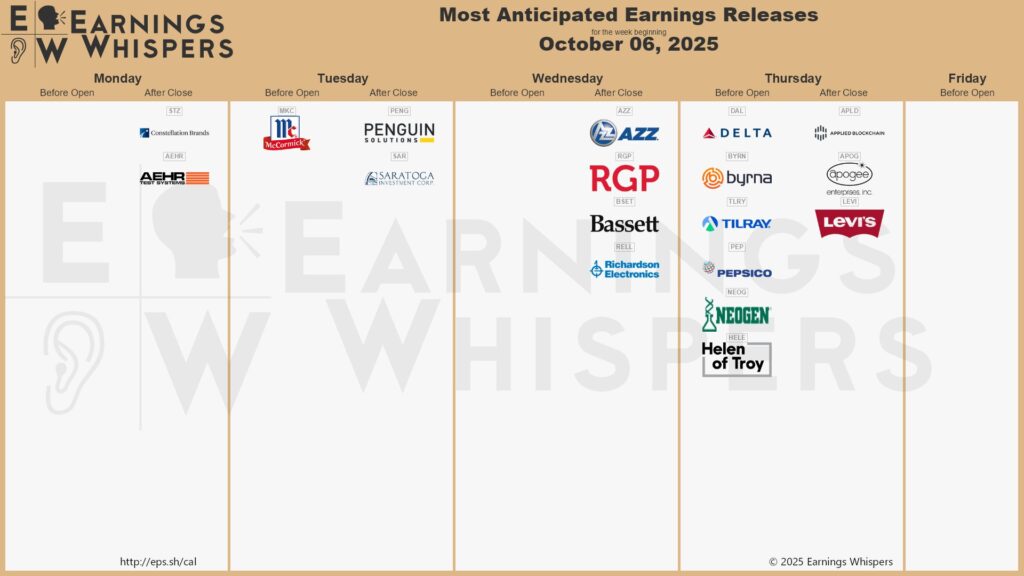
💼 While this week has a lighter schedule, earnings season is set to begin in mid-October, with major U.S. banks beginning to report:
📅 Monday, Oct 6th
- Constellation Brands, Inc. (STZ): Constellation Brands will report its Q2 fiscal 2026 results, with analysts forecasting earnings of $3.38 per share, a 21.7% year-over-year decline from $4.32 in the prior-year quarter. Revenues are expected to come in at $2.46 billion, down 15.8% from $2.92 billion a year ago. Market participants should focus on management’s commentary regarding consumer demand trends in the beer and wine segments, as well as the impact of cost-saving initiatives, including restructuring measures aimed at generating $200 million in net savings by fiscal 2028. They should also watch for any adjustment to full-year EPS guidance, which currently stands at $11.30 to $11.60.
📅 Tuesday, Oct 7th
- McCormick & Company, Incorporated (MKC): McCormick & Co. will report Q3 2025 results, with analysts forecasting adjusted EPS of $0.81 (versus $0.83 a year ago) and revenue of $1.71 billion, up 1.7% year-over-year. Market participants will focus on organic net sales growth, which the company continues to emphasize as a key performance metric in its guidance. McCormick has also declared a quarterly dividend of $0.45 per share, payable on October 27, marking its 101st consecutive year of dividend payments. Management commentary will be closely watched for updates on supply-chain costs and tariff mitigation efforts. In its 2025 outlook, McCormick reaffirmed expectations for 1% to 3% organic net sales growth and operating margin expansion, supported by cost savings programs and pricing actions.
📅 Thursday, Oct 9th
- PepsiCo, Inc. (PEP): PepsiCo is scheduled to report its Q3 2025 financial results, with current non-official consensus estimates placing adjusted EPS at approximately $2.26, down 2.1% year over year, and revenue at $23.86 billion, up 2.3% from the prior year. Market participants will pay close attention to organic revenue growth, which PepsiCo continues to guide at a low single-digit increase for 2025.
In Q2 2025, PepsiCo’s materials show PepsiCo Beverages North America’s (PBNA) organic volume trends included a ~1 percentage point headwind tied to the case-pack water transition, while PepsiCo Foods North America (PFNA) exhibited softer volumes, with a -1.5 percentage point impact on organic revenue. International remained a bright spot with 6% organic revenue growth in Q2, supported by Europe, the Middle East, and Africa (EMEA), with +7% organic revenue and Latin America Foods +6%, alongside international beverages +9%. For FY 2025, PepsiCo expects roughly a 1.5 percentage point foreign-currency translation headwind to its reported net revenue and core EPS growth.
- Delta Air Lines (DAL): Delta Air Lines will report Q3 2025 results. The company guides total revenue at 0% to up 4% year-over-year and an adjusted operating margin of 9%–11%, compared with 13.2% in Q2.
Delta expects non-fuel unit costs to be flat to down, calling this its best cost performance of 2025. Analysts’ EPS expectations of roughly $1.53 sit within the company’s official $1.25–$1.75 range. Market participants will focus on premium-cabin and loyalty revenue growth, domestic unit-revenue trends, and fuel-price or refinery-related effects on margins as key performance drivers.
- Levi Strauss & Co. (LEVI): Levi Strauss & Co. is scheduled to report its third-quarter results, with analysts forecasting EPS of $0.31 and revenue of $1.50 billion for the period ending August.
In Q2 FY2025, the company posted adjusted diluted EPS of $0.22 on net revenues of $1.446 billion, up 6% reported and 9% organic. Gross margin reached a record 62.6%, primarily driven by lower product costs and a favorable channel mix. Direct-to-consumer net revenues rose 11% and represented 50% of total net revenues. Management raised its full-year outlook, now expecting reported net revenue growth of 1 to 2 percent year over year and adjusted diluted EPS of $1.25 to $1.30, compared with the prior guidance range of $1.20 to $1.25.
Market participants will watch the Direct-To-Consumer momentum, regional performance including Europe at +14 percent reported and +15 percent organic in Q2, and margin sustainability with attention to gross margin, channel mix, and inventory levels.
We hope this helps and happy trading!
– Trade and Travel Team
Related Blogs


Follow Us
Testimonials
Hear from students on why they chose the Trade and Travel Family and how it has changed their lives.

