
Last week was a cocktail of escalating geopolitical conflict, surging oil prices, and an overwhelming jobs report sent all three major indexes tumbling, with the Dow posting its worst week in nearly a year. The SPY (S&P 500) dropped roughly 2%, the DIA (Dow Jones) fell approximately 3%, and the QQQ (Nasdaq) slid around 1.2% for the week ending March 6th.
The dominant story was oil and the war driving it. The U.S.-Iran conflict intensified sharply, disrupting traffic through the Strait of Hormuz, the narrow passage through which roughly 20% of the world’s daily crude oil supply flows. West Texas Intermediate crude closed the week at $90.90 a barrel, surging over 35%, its biggest weekly gain in the history of oil futures trading dating back to 1983. President Trump’s declaration on Truth Social that no deal would come without Iran’s “unconditional surrender” only added fuel to the fire, sending energy stocks higher while dragging the broader market lower.
The February Non-Farm Payrolls report on Friday showed the U.S. economy lost 92,000 jobs, a jarring miss against Wall Street expectations for a modest gain, while unemployment ticked up to 4.4%. The market is now being forced to price in something it hasn’t dealt with in years, a contracting labor market colliding head-on with an inflationary energy shock. That combination significantly complicates the Fed’s rate path.
Earnings season is winding down, and results were mixed. Some pockets of strength emerged in AI-related names, but the overall tone turned cautious as companies began flagging concerns about rising energy costs eating into margins.
Heading into this week, investors have a wave of data to navigate. CPI lands Wednesday, with the GDP second estimate due Friday. Reports that G7 finance ministers may discuss a joint emergency release of oil reserves could also move markets. With oil still elevated and the Iran conflict showing no signs of resolution, these readings can carry enormous weight. Stay alert.
How This Impacts You
If last week’s jobs data left you uncertain about the economy’s direction, this week may not deliver a clean answer either. The CPI print on Wednesday can swing markets in either direction; a hot number could send rate-sensitive holdings lower, while a cooler read could provide relief to growth stocks that have been under pressure. Friday’s back-to-back releases covering growth, inflation, and labor all at once is the kind of morning that can reset expectations quickly.
Rather than trying to position around every report, this may be a good week to revisit what you own and why you own it. Staying patient and giving yourself permission to not react to every headline is often the most durable strategy in a week this loaded with catalysts.
📅 Wednesday, Mar 11th
- Consumer Price Index (CPI): The BLS releases the February 2026 CPI, likely the week’s most market-sensitive data point. Last month’s report established the baseline with core CPI at +0.3% m/m and +2.5% year-over-year, while headline CPI came in at +0.2% m/m and +2.4% year-over-year.
The tariff dimension is the critical overlay heading into February’s data. The cumulative tariff burden on Chinese goods, running at roughly 35–40% through a combination of Section 301 duties and the 15% global tariff on February 20 after the Supreme Court struck down IEEPA-based tariffs, is transmitting into import-heavy goods categories, with analysts at Bank of America flagging household furnishings, apparel, and consumer electronics as the most exposed. Analysts broadly expect shelter to continue moderating slightly in February while core goods accelerate under tariff pressure.
Consensus projects February core CPI at +0.2% m/m, headline at +0.3%, and CPI year-over-year at +2.5%. A core print at or below consensus would ease rate-cut-delay fears and provide relief to growth and rate-sensitive equities. A hotter above core reading would extend the Federal Reserve’s wait-and-see posture and likely push Treasury yields higher to close the week.
📅 Thursday, Mar 12th
- Unemployment Claims: The Department of Labor releases advance seasonally adjusted Initial Jobless Claims for last week, the most real-time read on layoff activity available ahead of Thursday’s JOLTS report. The prior reading came in at 213,000, beating the Bloomberg consensus of 215,000 and reflecting essentially unchanged conditions from the revised prior week. The 4-week moving average stands at 215,750, well within the historically healthy sub-225,000 band.
Consensus for the upcoming report has not been formally published by major aggregators at the time of writing. The federal civilian employee claims under the UCFE program registered 529 in the most recent week (down 25 from the prior week) and deserve special attention: BLS methodology classifies workers on paid administrative leave as employed, meaning DOGE-related federal workforce disruptions would not appear in jobless claims until formal separations occur. Any spike in UCFE claims would be an early warning that the administrative leave phase is giving way to actual separations.
📅 Friday, Mar 13th
- Preliminary GDP Q4 2025: The Bureau of Economic Analysis is set to release the second estimate of Q4 2025 GDP, an update to the advance reading that incorporates additional source data from trade, inventories, and government spending. The advance estimate came in at +1.4% annualized, a sharp deceleration from Q3’s +4.4%, with the October through November federal government shutdown estimated to have subtracted approximately 1.0 percentage point from the headline.
Beneath the surface, the quarter showed meaningful divergence across components. Consumer spending held at +2.4% (services +3.4%), business investment contributed +3.7%, and real final sales to private domestic purchasers grew +2.4%, signals of underlying private-sector demand. Federal government spending collapsed 16.6%, with total government spending falling 5.1% as the shutdown’s fiscal drag pulled the headline number well below the approximately 2.5% Dow Jones consensus at the time.
Consensus for the second estimate stands at +1.4%, unchanged from the advance, making any upward or downward revision a potential market mover in a session already packed with data. A revision above 1.6% would support risk-on positioning; a downward revision toward 1.0% would deepen concern that Q1 2026 growth may also disappoint.
- Core PCE Price Index: The Bureau of Economic Analysis simultaneously releases the January 2026 Personal Consumption Expenditures Price Index, the Federal Reserve’s preferred inflation gauge and the most technically precise read on underlying price pressures, weighted toward services and away from the shelter-heavy CPI basket.
December 2025 Core PCE came in at +0.4% m/m and +3.0% year-over-year, the highest Core PCE reading since April 2024, a milestone that reinforced the Fed’s patient stance on rate cuts and contributed to the broad repricing of easing expectations into late 2026. Headline PCE ran at +2.9% year-over-year in December.
Consensus for January stands at +0.4% month-over-month. A downside surprise, +0.3% or below, could be the most positive surprise of the week for equity markets. A +0.5% print would likely be damaging, extending the narrative that inflation has re-accelerated above even the elevated pace of late 2025.
- JOLTS Job Openings: The Bureau of Labor Statistics releases the January 2026 Job Openings, completing a macro trifecta within 90 minutes of the GDP and Core PCE releases and providing the most comprehensive mapping of labor demand available in the statistical calendar.
December 2025 established a concerning baseline: job openings fell to 6.54 million (rate: 3.9%), the lowest rate since December 2017 outside of the pandemic trough, and 966,000 below the level one year prior. All three labor flow measures; hires (5.3 million), quits (3.2 million, rate 2.0%), and layoffs (1.8 million, rate 1.1%) have been essentially flat for much of the past year, a configuration characterized as a “low-hire, low-fire” equilibrium. The quits rate at 2.0% is below the pre-pandemic 2019 average and signals that workers feel insufficiently confident to leave voluntarily, a suppressor of wage growth and a sign that the labor market’s cooling is demand-side rather than distress-driven.
Consensus for January job openings stands at 6.84 million, a rebound of roughly 300,000 from December’s 6.54 million that would snap the recent downtrend. A print above 7.0 million would signal genuine demand recovery and reduce urgency for Fed rate cuts. A print below 6.5 million, particularly if accompanied by a further decline in the quits rate, would deepen labor demand concerns and amplify the case for easing. Watch the government-sector openings sub-component for any early read on DOGE’s structural impact on public-sector labor demand.
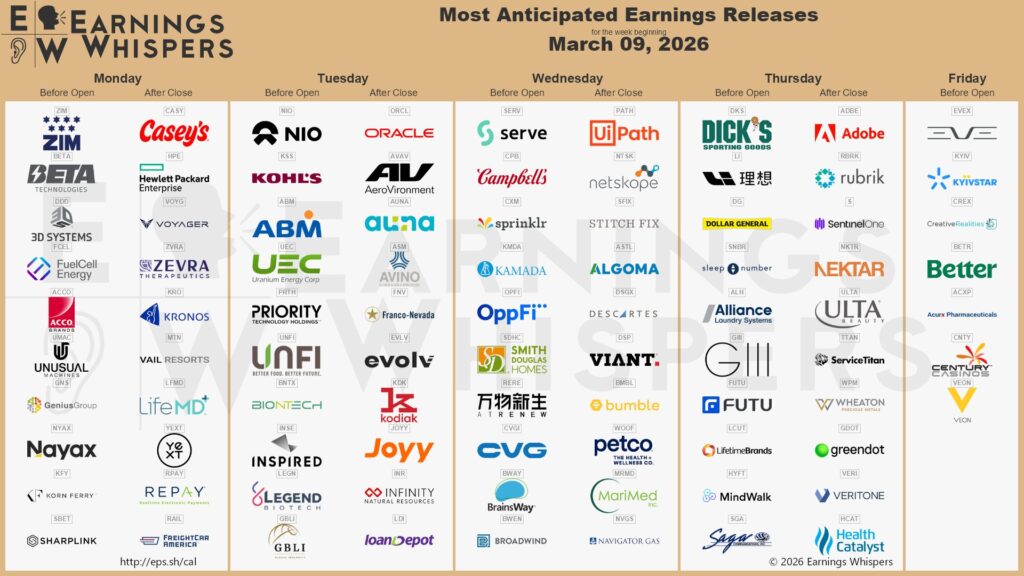
💼 Earnings season continues this week as enterprise tech, retail, and biotech companies report on AI spending and consumer health.
📅 Monday, Mar 9th
- Hewlett Packard Enterprise (HPE): HPE is scheduled to report its fiscal Q1 2026 results, with analyst consensus projecting earnings of $0.59 per share on revenue of $9.32 billion, representing year-over-year growth of approximately +20.4% on EPS and approximately +18.7% on revenue from the results delivered in Q1 FY2025.
HPE achieved double-digit revenue growth (+16% YoY) driven by server revenue of $4.3 billion (+29% YoY) and booked $1.6 billion in new AI orders, double-digit growth year-over-year, reflecting broad enterprise demand for HPE’s Cray EX, Cray XT, and ProLiant Gen11 AI-optimized server portfolio; however, the quarter came with gross margin compression to 29.4% (below the 31.3% consensus expectation), signaling that the high-volume AI server buildout was competing with traditional enterprise margins.
The key question entering Q1 FY2026 is whether HPE can sustain the revenue momentum while recovering margins: the company has warned that AI server revenues are expected to decline sequentially in Q1 FY2026 due to the lumpy nature of large sovereign AI infrastructure deals, several high-value contracts are expected to ship later in the fiscal year, making GreenLake’s recurring subscription performance the primary margin support mechanism; GreenLake ARR surpassed $2 billion in Q1 FY2025 (+46% year-over-year in constant currency), with the customer base growing from 31,000 to 41,000 by Q1 FY2025 and reaching approximately 44,000 by the end of FY2025, a trajectory that carries greater predictability and margin stability than the project-based AI server business.
CEO Antonio Neri has described HPE’s positioning as capturing massive opportunities in private cloud AI and Gen12 server adoption, while also navigating tariff-related supply chain pressures. Tariff headwinds were among the concerns HPE flagged in late 2025, adding cost uncertainty to an already margin-compressed server business.
Consensus projects $0.59 EPS and $9.32 billion in revenue for Q1 FY2026; a beat on both headline figures alongside margin recovery guidance would signal that the FY2025 margin trough is behind the company and could re-rate a stock that has lagged its AI infrastructure peers; a miss on margins or an AI server order weakness signal would raise questions about whether HPE can convert its AI infrastructure narrative into sustained profitability growth, particularly as Oracle and hyperscaler cloud platforms compete for the same enterprise AI workloads.
📅 Tuesday, Mar 10th
- Oracle Corporation (ORCL): Oracle is scheduled to report its fiscal Q3 2026 results, with analyst consensus projecting earnings of $1.71 per share on revenue of approximately $16.87 billion, in line with the company’s own guidance. If estimates prove accurate, it would represent a +16.3% year-over-year advance, while the revenue consensus implies approximately +19% growth from the same quarter last year.
The most consequential storyline is Oracle’s AI infrastructure transformation: total remaining performance obligations (RPO) reached $523 billion, up 438% year-over-year, driven by mega-deals with Meta and Nvidia as Oracle positions Oracle Cloud Infrastructure (OCI) as the destination for large-scale AI training and inferencing workloads, a competitive claim the company has backed with an approximately $50 billion capex commitment for FY2026, up from $21.2 billion in FY2025, and a record $25 billion bond offering completed in early 2026 to fund the buildout.
Management’s long-term OCI targets, $18 billion in FY2026 revenues (implying 77% full-year growth) and $144 billion by FY2030, frame this as a multi-year compounding story, but those projections require sustained capex that is already pressuring free cash flow and has required the company to carry approximately $124 billion in total debt. For the March 10 call, investors will be benchmarking three binary outcomes: whether cloud revenue beats or misses the 37%–41% guidance range; whether management raises, maintains, or lowers the $67.0 billion FY2026 revenue guide; and whether RPO converts to revenue faster than the market currently models, a beat on all three would likely drive a significant relief rally.
📅 Thursday, Mar 12th
- Dollar General Corporation (DG): Dollar General is scheduled to report its fiscal Q4 2025, with analyst consensus projecting earnings of approximately $1.61 per share on revenue, a reading that, if achieved, would represent a modest year-over-year decline from the $1.68 per share delivered in the same quarter last year, underscoring the continued margin pressure Dollar General has navigated as it works to restore profitability after a multi-quarter stretch of operational challenges.
Dollar General raised its full-year FY2025 guidance across successive quarters, arriving by Q3 FY2025 at net sales growth of 4.7%–4.9% and same-store sales growth of 2.5%–2.7%, providing a backdrop of modest but durable top-line momentum heading into Q4.
On tariffs, Vasos has stated that Dollar General intends to use price increases “as a last resort,” with management indicating the company has prior experience navigating tariff-driven cost escalation and will prioritize cost absorption before passing increases to consumers; however, the company sources a meaningful portion of its merchandise from China, creating a margin risk that consensus estimates will be scrutinizing for Q4 and more acutely in the FY2026 guidance. Dollar General plans to open 450 new stores in 2026 and remodel 4,250 existing locations, a capital-intensive growth agenda funded by operating cash flow that signals management’s conviction in the format’s long-term relevance despite near-term headwinds.
Consensus projects ~$1.61 EPS for Q4 FY2025; the more consequential disclosure will be FY2026 same-store sales guidance (management’s target is 2%–3%) and any commentary on tariff-related cost trajectory, a downside EPS guidance range for FY2026 or margin compression language would likely extend DG’s underperformance relative to discount retail peers, while a beat on Q4 comp sales and a constructive FY2026 outlook would support the view that the worst of the operational reset is behind the company.
- DICK’S Sporting Goods, Inc. (DKS): DICK’S Sporting Goods is scheduled to report its fiscal Q4 and full-year 2025 result, with analyst consensus projecting earnings of approximately $2.99 per share, a figure that reflects the first complete holiday quarter consolidating the Foot Locker acquisition, making the year-over-year comparison to Q4 FY2024’s standalone $3.62 per share and $3.89 billion in revenue structurally non-comparable.
Q4 FY2024 represented the DICK’S business at peak standalone efficiency, while Q4 FY2025 consolidates two distinct retail businesses with meaningfully different margin profiles during the critical first holiday season of integration.
The Foot Locker integration is the central narrative of Q4 FY2025: when DICK’S completed the acquisition of Foot Locker, Inc., it assumed a business operating under five distinct banners, Foot Locker, Kids Foot Locker, Champs Sports, WSS, and atmos, spanning more than 3,200 stores across 20 countries, giving DICK’S immediate international scale in athletic footwear that the company had not previously pursued organically; however, the Foot Locker business entered its first DICK’S-owned quarter in a challenged operational state: management guided Q4 FY2025 Foot Locker gross margins to decline 1,000–1,500 basis points versus the prior year and Foot Locker pro forma comparable sales to be down mid-to-high single digits, with Q4 Foot Locker operating profit expected to be slightly negative.
Despite the near-term margin drag, management has expressed conviction that the Foot Locker acquisition will be accretive to EPS in FY2026, excluding one-time integration costs, a projection rooted in the expectation that combined buying scale, inventory rationalization, and shared infrastructure will restore the Foot Locker segment’s profitability as the integration matures; CEO Lauren Hobart has framed the acquisition as a multi-year value creation event that extends DICK’S reach from its domestic sporting goods stronghold into global athletic footwear, a category where the DICK’S brand, through its House of Sport concept and private label expansion, has been gaining share with younger athletes and sneaker-focused consumers.
Consensus projects ~$2.99 EPS for Q4 FY2025; the critical disclosures on March 12 will be FY2026 consolidated guidance, specifically whether management provides a combined EPS outlook that demonstrates credible Foot Locker margin recovery, and whether the DICK’S comparable sales trajectory held above the 3.5% floor of the FY2025 guidance range through Q4.
- Adobe Inc. (ADBE): Adobe is scheduled to report its fiscal Q1 2026 results, with analyst consensus projecting earnings of $5.87 per share on revenue of $6.28 billion, closely aligned with Adobe’s own guidance. Should consensus prove accurate, it would mark a +15.6% year-over-year increase from the same period last year while the revenue estimate implies approximately +10% year-over-year growth, a rate consistent with Adobe’s stated FY2026 total Adobe ARR growth target of 10.2% year-over-year.
Adobe closed FY2025 with record results: full-year revenue of $23.77 billion and EPS of $20.94, with total Adobe ARR reaching $25.2 billion (+11.5% year-over-year), Digital Media ARR at $19.2 billion, and creative monthly active users across Firefly, Express, Premiere Mobile, and other freemium offerings surpassing 70 million, growing more than 35% year-over-year, as AI features drove materially higher engagement across the product portfolio. The core narrative heading into Q1 FY2026 is AI monetization: generative credit consumption across Creative Cloud, Firefly, and Express by individuals and enterprises grew approximately 3x quarter-over-quarter in Q4 FY2025, and Firefly Services enterprise deals grew by more than 100 new contracts in Q4.
CEO Shantanu Narayen characterized the FY2025 results as reflecting “our growing importance in the global AI ecosystem”; AI-first ARR, the discrete revenue line tracking products like Acrobat AI Assistant, Firefly App and Services, and GenStudio for Performance Marketing, already exceeded its $250 million year-end target exiting Q3 FY2025 and is expected to have continued scaling through Q4 and into Q1 FY2026.
The bear thesis is that generative AI commoditizes the creative process, reducing the value proposition of Creative Cloud subscriptions as open-source and competitor tools proliferate, while the bull thesis holds that Firefly’s native integration within Photoshop, Premiere, and Acrobat deepens platform lock-in rather than disrupting it; Q4 FY2025 provided limited resolution: the quarter beat expectations on revenue and earnings but delivered guidance that the market characterized as light, contributing to a post-earnings stock decline even as operating fundamentals remained strong.
Investors will be focused on three metrics when results arrive: Digital Media net new ARR as the most direct proxy for Creative Cloud subscriber growth and monetization health; any quantitative AI ARR disclosure that would allow the market to size the Firefly and GenStudio revenue contribution independent of core subscriptions; and management’s tone on the FY2026 ARR growth target in the context of a tariff-uncertain macro environment where enterprise and small-business customers are under spending pressure, a soft tone on either the AI buildout or subscription renewal rates would likely extend ADBE’s underperformance versus the broader market.
We hope this helps and happy trading!
— Trade and Travel Team
Related Blogs


Follow Us
Testimonials
Hear from students on why they chose the Trade and Travel Family and how it has changed their lives.

