
Last week handed investors a reminder of market volatility. The period began on an optimistic note after the Supreme Court struck down President Trump’s reciprocal tariffs imposed under the International Emergency Economic Powers Act (IEEPA) the prior Friday. A ruling that initially sent markets surging.
Retail and consumer-facing names rallied on the prospect of lower import costs. But the celebration was short-lived. The administration quickly pivoted, announcing a new 10% global tariff under different legal authority, with Trump signaling rates could climb to 15%. The tariff saga is far from over, and investors should watch closely as this legal and political chess match continues.
For the week, the SPY (S&P 500) fell roughly 0.5%, the QQQ (NASDAQ) dropped about -0.25%, and the DIA (Dow Jones) slid approximately -1.29%.
Mid-week, NVIDIA delivered another impressive earnings quarter, but the results failed to ignite a broader rally, triggering further rotation out of mega-cap tech into defensive and cyclical sectors. The software sector continued its brutal slide, down nearly 10% for February. Then a hot Producer Price Index print on Friday sent all three major indexes lower to close the week and the month on a sour note.
This week brings a loaded calendar. The nonfarm payrolls report drops Friday and carries extra weight after last week’s inflation scare. PMI data for manufacturing and services will set the tone early. Geopolitical tensions around Iran remain in focus. Add in key earnings across cybersecurity, semiconductors, and retail, and you’ve got a week that could define the market’s direction into spring.
How This Impacts You
If you’ve been feeling unsettled watching the market shift from optimism to uncertainty in just a few days, that makes sense. Between changing tariff policies, hotter inflation data, and tech stocks pulling back, it can feel like a lot to process when you already carry so much responsibility.
This may be a good moment for you to slow down and simply review what you currently own and why, instead of reacting to every headline that comes across your screen. With payroll data and other economic reports ahead, staying patient and keeping some flexibility in your positioning could help you feel more grounded while markets sort themselves out.
📅 Monday, Mar 2nd
- The ISM Manufacturing PMI: The upcoming ISM Manufacturing PMI report is forecast to print at 51.7%, compared to January’s 52.6%, which ended a streak of 10 consecutive months of contraction from March through December 2025 and marked the strongest reading since August 2022.
The expansion was broad-based across key sub-indices: New Orders surged to 57.1, a 9.7-point swing from December’s 47.4, and the largest single-month component gain while Production climbed to 55.9, and the Backlog of Orders reached 51.6, its highest level since August 2022; however, Employment remained in contraction at 48.1, and the Prices Paid index held at an elevated 59.0, up from 58.5 in December, signaling persistent input-cost pressure.
ISM Manufacturing Business Survey Committee Chair Susan Spence noted that although January’s expansion was a positive signal, some survey respondents highlighted that buying patterns may have reflected typical post-holiday reordering and efforts to get ahead of expected tariff-related price increases, a cautionary note on the sustainability of the recovery.
📅 Wednesday, Mar 4th
- ADP Non-Farm Employment Change: ADP is scheduled to release the February 2026 National Employment Report, a monthly estimate of U.S. private-sector payroll additions derived from anonymized payroll records covering more than 26 million employees that provides one of the earliest independent reads on labor market conditions ahead of the official nonfarm payrolls report.
The January 2026 headline of +22,000 private jobs fell − 15,000 short of December 2025’s downwardly revised reading of +37,000 (originally reported at +41,000 ) and missed the approximately 48,000 consensus estimate, with ADP Chief Economist Nela Richardson noting that “job creation took a step back in 2025, with private employers adding 398,000 jobs, down from 771,000 in 2024”.
January’s sectoral picture was sharply bifurcated: education and health services led all industries at +74,000, and financial activities contributed +14,000, while professional and business services shed −57,000 positions, the largest single-sector drag, and manufacturing contracted −8,000, extending its job-loss streak to every month since March 2024.
January’s weak ADP print arrives amid heightened trade-policy uncertainty and rising input-cost concerns, leaving investors to debate whether the slowdown reflects typical post-holiday normalization or a more durable softening in employer confidence heading into the February labor data.
📅 Thursday, Mar 5th
- Unemployment Claims: The U.S. Department of Labor’s Employment and Training Administration(ETA) is scheduled to release the advance seasonally adjusted Initial Jobless Claims for the week ending February 28. A weekly tally of first-time unemployment insurance filings that functions as a real-time leading indicator of layoff activity, with readings below 225,000 historically consistent with a healthy labor market and sustained readings above 250,000 signaling emerging softness.
The most recently reported figure, the week ending February 22, came in at 212,000, a +4,000-claim increase from the prior week’s revised 208,000, following the week ending February 15’s 206,000 advance print, a sharp −23,000-claim decline from the 229,000 recorded in the weather-distorted week ending February 8.
The 4-week moving average registered 220,250, a +750-claim uptick from 219,500, but well within the historically healthy sub-225,000 band. Accompanying data showed continuing claims for the week ending *February 14* falling −31,000 to 1,833,000, consistent with limited re-employment difficulty, while federal civilian employee claims (UCFE program) declined to 554 from 695 the prior week.
Carl Weinberg of High Frequency Economics stated the data show “no sign of the layoffs we would expect in a weakening labor market”, capturing the prevailing low-hire, low-fire equilibrium in which employers retain existing headcount while curtailing new hiring, a pattern compounded by tariff-driven business uncertainty that is suppressing hiring appetite rather than accelerating separations.
📅 Friday, Mar 6th
- Average Hourly Earnings m/m: The Bureau of Labor Statistics (BLS) is scheduled to release the February 2026 Employment Situation report, which includes Average Hourly Earnings, a monthly measure of average hourly compensation for all employees on private nonfarm payrolls that serves as a closely watched gauge of wage-driven inflationary pressure and consumer purchasing power.
The January 2026 headline reading came in at +0.4% month-over-month — a +0.3 percentage-point acceleration from December 2025’s downwardly revised +0.1% — lifting the all-employees average to $37.1 7 (up $0.15), with year-over-year growth at +3.7% as nominal wage gains continue tomoderate gradually from the 4.0%-plus pace of mid-2024.
Breadth was evident across worker categories and metrics: production and nonsupervisory employees posted a matching +0.4% monthly gain to $31 .95, average weekly hours for all employees edged up 0.1 hour to 34.3 from December’s 3 4.2, and real average hourly earnings — adjusted for consumer-price inflation — advanced +1.5% year-over-year through January 2026, confirming that nominal wage growth continues to outpace headline CPI by roughly one percentage point. - Core Retail Sales m/m: The U.S. Census Bureau will release the January 2026 Advance Monthly Retail Trade and Food Services Survey. Economists focus closely on retail sales excluding motor vehicles, a cleaner signal of underlying consumer demand across roughly 12,000 surveyed retailers.
In December 2025, this core measure was flat at 0.0% month-over-month, missing expectations for a +0.3% increase and slowing from November’s +0.4% gain. The retail control group, which excludes autos, gasoline, building materials, and food services and feeds directly into GDP personal-consumption calculations, declined −0.1% after rising +0.2% previously.
Category performance showed resilience in services and e-commerce, with nonstore retailers up 5.3% year over year and food services rising 4.7%, while overall retail and food services sales totaled $735.0 billion for the month. The sharper miss in the control group relative to headline ex-auto sales suggests late-year softness was concentrated in discretionary categories most sensitive to interest rates and household budget pressure.
- Retail Sales m/m: The headline Retail Sales report remains the timeliest official gauge of U.S. consumer activity, which accounts for roughly two-thirds of GDP, making it a key driver of market expectations for growth and Federal Reserve policy.
December retail sales were unchanged at 0.0% month-over-month ($735.0 billion), missing consensus forecasts for a +0.4% rise and decelerating sharply from November’s +0.6% advance. On a year-over-year basis, sales growth slowed to 2.4%, down from 3.3% the prior month, reinforcing evidence of gradually moderating consumption momentum.
Weakness was concentrated in discretionary goods categories, including furniture, apparel, electronics, and autos, partially offset by gains in building materials and gasoline stations. Markets will now watch whether January spending rebounds after the post-holiday slowdown or confirms a broader cooling trend that could strengthen expectations for eventual Federal Reserve rate cuts under its current data-dependent stance.
- Non-Farm Employment Change: The Bureau of Labor Statistics (BLS) is scheduled to release the February 2026 Employment Situation, with total + nonfarm payrolls — the headline metric measuring the monthly net change in U.S. jobs across all non-agricultural industries — serving as the market’s primary gauge of labor-market momentum.
The January 2026 report showed a gain of +130,000 nonfarm payrolls — the strongest monthly increase since December 2024 and well above the market consensus of approximately 70,000 — representing a +82,000 acceleration from December 2025’s downwardly revised +48,000, itself part of a broader recalibration in which BLS annual benchmark revisions cut total 2025 nonfarm employment growth from +584,000 to +181,000, reducing average monthly gains to just 15,000.
November 2025 payrolls were simultaneously revised down to +41,000 from +56,000 (−15,000). The BLS Employment Situation report is a statistical release without interpretive commentary; the dominant macro question heading into the February data is whether January’s rebound reflected genuine labor-market acceleration or one-time seasonal catch-up in health care.
Economist forecasts for February payroll growth vary widely, with many private estimates clustering near the 100,000 mark. Markets will watch whether health care sustains its outsized contribution to hiring and whether the unemployment rate, which held at 4.3% in January, begins to drift higher as aggregate demand shows signs of cooling.
- Unemployment Rate: The Bureau of Labor Statistics (BLS) will release the February 2026 Employment Situation, encompassing the civilian Unemployment Rate (U-3). U-3 measures the share of the civilian labor force that is jobless and actively seeking work, and serves as a primary Federal Reserve benchmark for gauging labor market slack.
The January 2026 unemployement rate printed at 4.3%, down 0.1 percentage point from December 2025’s 4.4%, yet remains 0.3 percentage points above the year-ago January 2025 level of 4.0%, reflecting a gradual cooling trend over the past year; BLS reported nonfarm payrolls expanded by 130,000 in January, above expectations, while the labor force participation rate held steady at 62.5% and the employment-population ratio came in at 59.8%.
The dominant interpretive question for February’s release is whether federal workforce adjustments begin translating into measurable separations. Under the BLS household survey methodology, workers on paid administrative leave are classified as employed, meaning any displacement would appear in unemployment figures only upon formal separation. Markets will watch whether the headline holds near 4.3%, or drifts higher toward the 4.4–4.5% range.
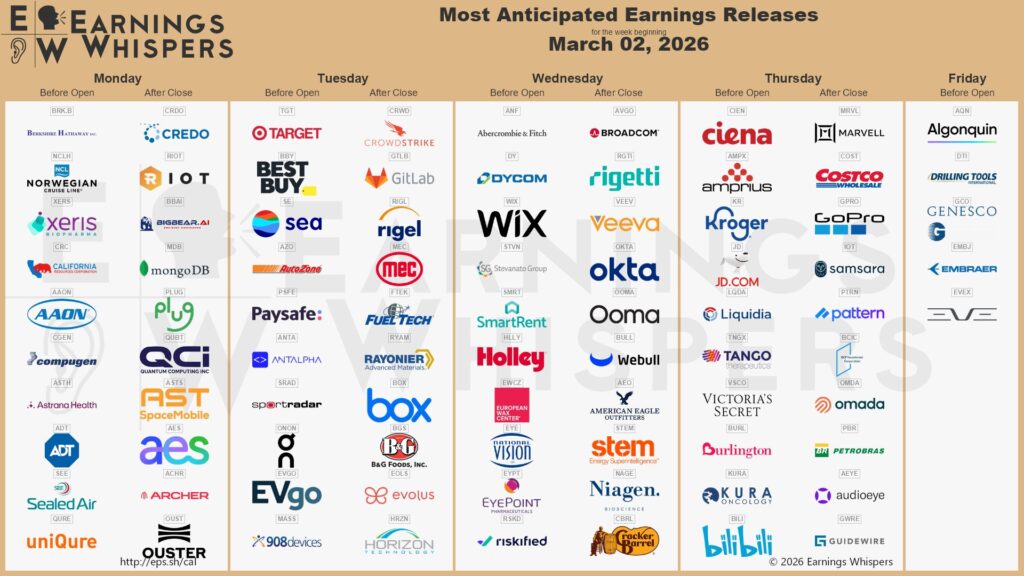
💼 Earnings season continues next week as companies across retail, technology, and consumer sectors report, giving investors a clearer read on profit trends and demand conditions.
📅 Monday, Mar 2nd
- MongoDB, Inc. (MDB): MongoDB is scheduled to report fiscal Q4 2026 results, with Wall Street consensus projecting earnings of $1.47 per share on revenue of approximately $668 million, aligned with the company’s own Q4 guidance range of $665–$670 million.
Atlas, MongoDB’s fully managed cloud database service, grew 30% year-over-year last quarter and represented 75% of total revenue, up from 71% during the same period last year. The customer franchise continues to broaden at scale: total customers reached 62,500 as of October 31, 2025, up from 54,500 in Q4 FY2025, while high-value accounts generating more than $100,000 in annualized revenue expanded to 2,694 from 2,396 a year earlier, evidencing durable enterprise penetration.
Subscription revenue reached $609.1 million last quarter, a 19% year-over-year advance, and analysts project Atlas consumption will again be the dominant Q4 earnings driver, with any surprise to the guided 27% Atlas growth rate likely to set the tenor of Q1 FY2027 guidance.
The dominant thematic for the call is artificial intelligence: MongoDB’s 2025 acquisition of Voyage AI embeds retrieval and reranking models directly into its stack, with CEO Desai citing approximately 22% improved retrieval accuracy for AI applications, though he was candid that large-scale enterprise agentic deployments remain “still fairly early”, positioning AI as a multi-year structural tailwind rather than an immediate revenue catalyst for Q4.
📅 Tuesday, Mar 3rd
- AutoZone, Inc. (AZO): AutoZone is scheduled to release its fiscal Q2 2026 results, with analyst consensus projecting earnings of $27.58 per share on net sales of approximately $4.30 billion. The revenue consensus implies 8.8% year-over-year growth from the $3.952 billion reported in the same period last year.
The commercial, or Do-It-For-Me, channel is the primary top-line growth driver: domestic commercial sales reached $1.29 billion last quarter, up 14.5% year over year, with average weekly sales per commercial program of $17.5 thousand growing 10.1% versus the prior year; the program now operates across 6,182 domestic locations, approximately 93% of domestic stores, and is supported by 137 mega hub locations, which extend same-day parts depth and SKU assortment to professional repair accounts, building on Q2 FY2025’s $1.052 billion commercial result (+7.3% year over year).
AutoZone’s global footprint reached 7,710 stores at the close of Q1 FY2026, 6,666 in the U.S., 895 in Mexico, and 149 in Brazil, a net increase of 278 locations versus the 7,432 total at the close of Q2 FY2025, with international comparable-store sales growing 9.5% on a constant-currency basis in Q2 FY2025 as further evidence of the broadening geographic demand base.
The March 3 call is expected to revisit tariff exposure. On the Q1 FY2026 earnings call, CEO Phil Daniele noted that tariff-induced cost increases have largely tracked through discretionary product categories rather than core repair and maintenance parts, the essential items comprising the bulk of AutoZone’s revenue, and that cost inflation is expected to build through the fiscal third quarter before moderating later in the year; lower-income customers, meanwhile, have been under financial pressure for some time but remain “relatively stable” with “no significant wobble,” per Daniele, while an aging U.S. vehicle fleet now averaging approximately 12.8 years continues to generate durable repair-parts demand independent of near-term consumer sentiment.
- Target Corporation (TGT): Target is scheduled to report fiscal Q4 2025 results, with analyst consensus calling for earnings of approximately $2.16 per share on revenue of about $30.54 billion. If realized, that would mark a 10.4% year-over-year decline from the $2.41 per share reported in the same quarter last year. Revenue expectations of $30.54 billion imply a modest 1.2% year-over-year contraction from the $30.9 billion in net sales recorded a year ago.
On the digital front, comparable digital sales grew 2.4% last quarter, a meaningful deceleration from the 8.7% posted in the same period a year ago. Yet same-day delivery powered by Target Circle 360 expanded more than 35% in the last quarter, establishing the paid membership platform as Target’s highest-velocity fulfillment channel. Loyalty momentum provides one constructive data point: Target Circle and Circle 360 together have added 13 million new members since the paid program’s launch, while Target Circle Card penetration stood at 17.6% of net sales in Q4 FY2024, reflecting the card’s continued role in driving basket and frequency.
CEO Michael Fiddelke, who assumed the role on February 1, 2026, will lead his inaugural earnings call, with investors expecting him to address Target’s tariff exposure, approximately 30% of store-label merchandise is sourced from China, alongside persistent consumer confidence headwinds that management has identified as a material drag on discretionary spending.
📅 Wednesday, Mar 4th
- Broadcom Inc. (AVGO): Broadcom is set to report Q1 fiscal year 2026 results, with Wall Street consensus calling for revenue of approximately $19.21 billion and EPS of $2.02. The company’s own guidance targets consolidated revenue of roughly $19.1 billion, representing a 28% increase year over year.
The marquee figure to watch is AI semiconductor revenue, which management has guided to approximately $8.2 billion for the quarter, nearly doubling from a year ago, driven by surging demand for custom accelerators (XPUs) and AI networking products like the Tomahawk 6 switch. Broadcom’s AI-related order backlog stands at over $73 billion deliverable over the next 18 months, accounting for roughly half of the company’s consolidated backlog of $162 billion, underscoring the depth and visibility of its hyperscaler pipeline.
Non-AI semiconductor revenue is expected to come in at roughly $4.1 billion, flat year over year and down sequentially due to typical wireless seasonality. Infrastructure software revenue, powered by VMware Cloud Foundation (VCF) adoption, is guided at approximately $6.8 billion for Q1, roughly flat sequentially due to seasonal renewals, though management expects the segment to deliver low double-digit growth for the full fiscal year 2026; this segment accounted for 42% of FY2025’s $63.9 billion in total revenue.
With a market capitalization of approximately $1.57 trillion and shares trading near $318, the upcoming report will be a critical test of whether Broadcom’s AI-driven growth narrative, anchored by a record backlog and accelerating custom silicon demand, can sustain its premium valuation.
📅 Thursday, Mar 5th
- Costco Wholesale Corporation (COST); Costco is scheduled to report its fiscal Q2 2026 results, with Wall Street consensus projecting earnings of $4.53 per share on revenue of $69.29 billion. That would represent a 12.7% year-over-year increase from the $4.02 per share delivered during the same period last year.
Membership remains the bedrock of Costco’s model: the company carried 81.4 million paid members entering Q2, up 5.2% year over year, while sustaining a U.S. renewal rate of approximately 92%, among the highest in retail. Membership fee revenue is projected at approximately $1.33 billion, up roughly 11.6% year over year, as the September 2024 fee adjustment, Gold Star at $65 annually, Executive at $130, is now fully embedded in the comparative period.
Comparable sales growth of approximately 6.5% is expected, with global shopping traffic trends, which expanded 5.7% in the year-ago quarter, serving as a critical KPI for gauging durable consumer engagement. A key theme for the March 5 call will be management’s tariff mitigation playbook: CEO Ron Vachris has indicated buyers are actively sourcing alternative value items in affected categories, leveraging Costco’s scale to protect member price value.
We hope this helps and happy trading!
– Trade and Travel Team
Related Blogs


Follow Us
Testimonials
Hear from students on why they chose the Trade and Travel Family and how it has changed their lives.

