
Apple dominated the week’s corporate headlines on Monday morning when Tim Cook announced in a public letter that he will step down as CEO effective September 1, 2026, handing the role to Senior Vice President of Hardware Engineering John Ternus and transitioning to Executive Chairman.
The announcement ended fifteen years of Cook’s tenure, during which Apple grew into a $4 trillion company, and frames the April 30 fiscal Q2 print as the first earnings call after the September 1 transition was announced. AAPL shares slipped modestly on the succession news but recovered through the week alongside the broader mega-cap tape.
The market’s overall tone remained risk-on, with the S&P 500 adding about 0.8% on Friday to close at a fresh record. The Nasdaq Composite rose 1.64% on Friday and logged its own record close as semiconductors continued to lead, while the Dow Jones slipped 0.2% on Friday as defensive names lagged the AI rally.
Two policy stories reshaped the late-week narrative. On April 21, Kevin Warsh appeared before the Senate Banking Committee for his Fed Chair confirmation hearing, with the nominee vowing to defend Fed independence and distancing himself from any suggestion he would serve as a political instrument. Warsh disclosed personal assets between $131 million and $209 million, far exceeding any prior Fed Chair.
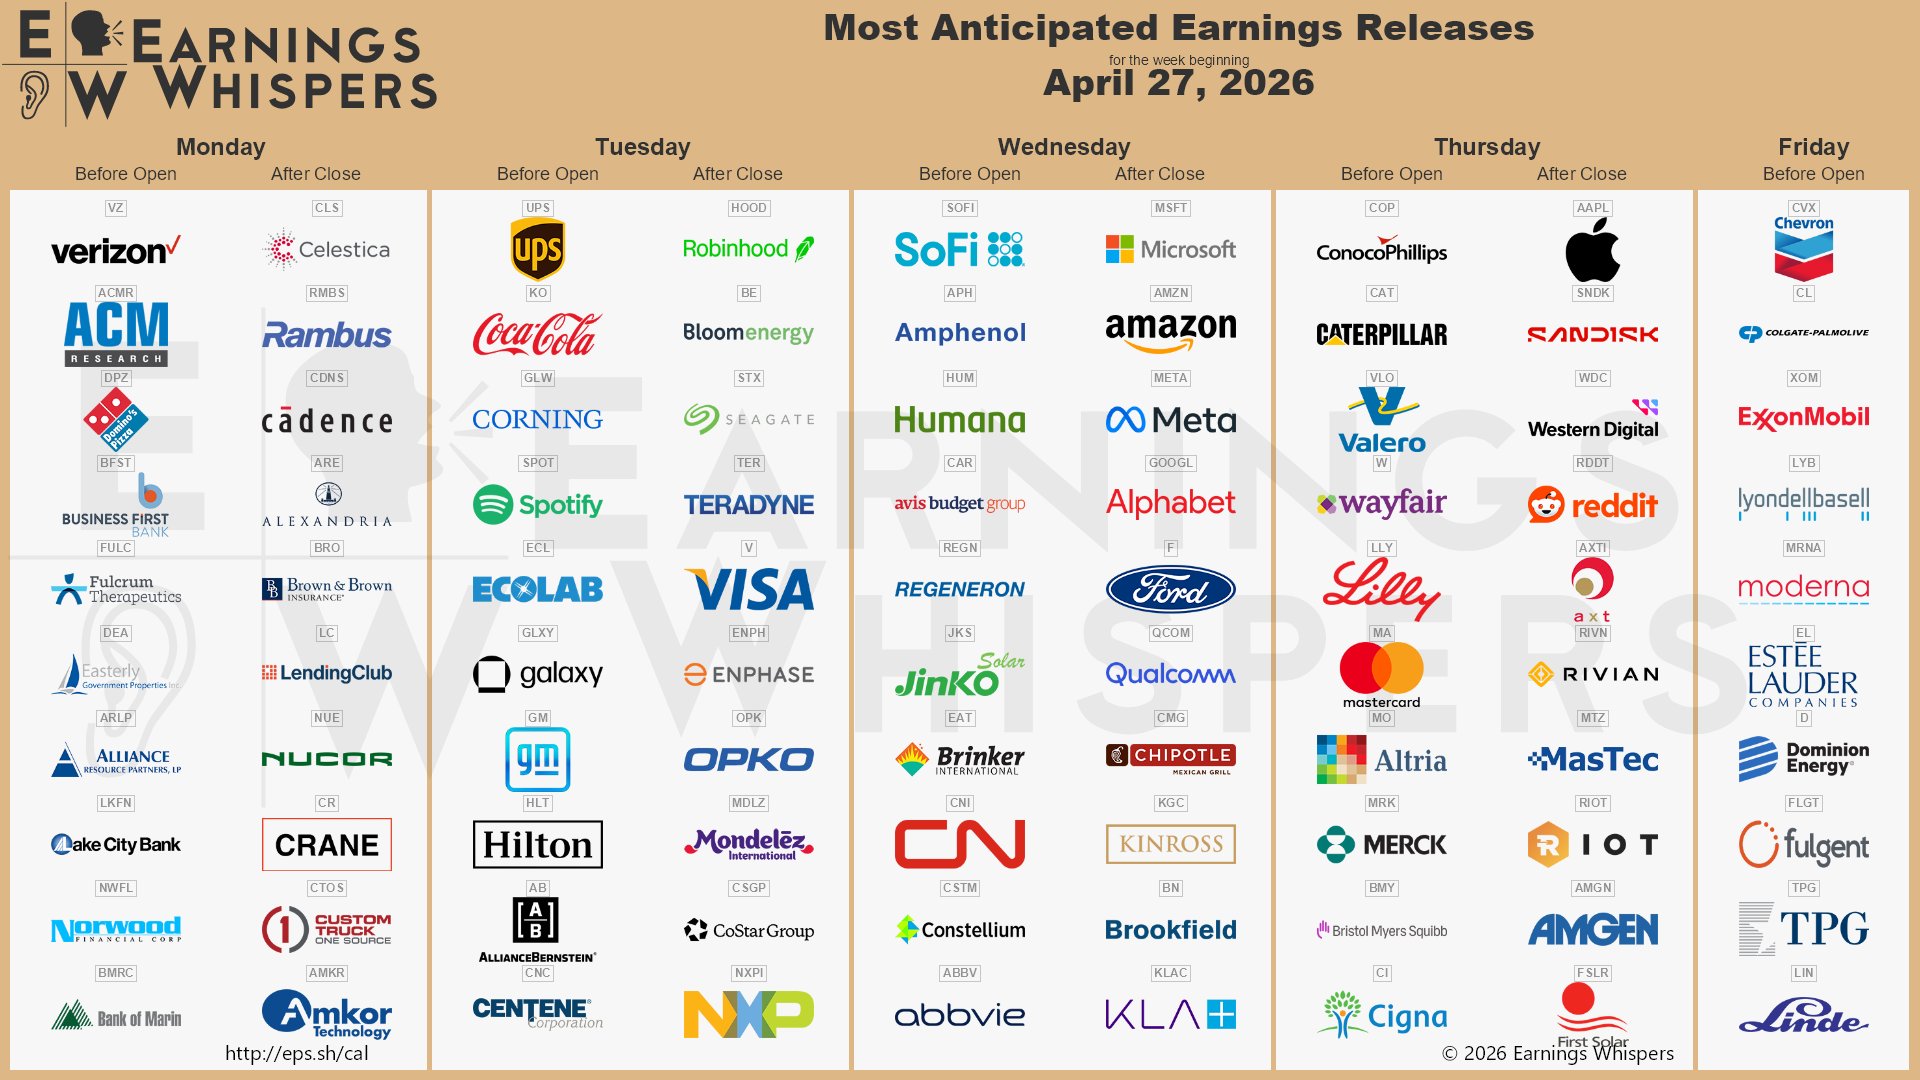
Looking ahead, the April 28-29 FOMC meeting now represents Powell’s final rate decision as Chair, while the mega-cap earnings slate (Alphabet, Meta, Amazon, Apple) and April 30 Advance GDP, Core PCE, and Employment Cost Index, create the densest single-week macro and micro calendar of the earnings season.
How This Impacts You
This could be the densest week of 2026. The single thread worth watching for an investor isn’t any one beat or miss, but whether mega-cap capex discipline (Meta at $135 billion, Amazon near $200 billion) continues to widen the gap between the AI infrastructure leaders and the rest of the tape.
If Core PCE comes in at 2.7% or hotter on Thursday, the Fed’s cut window stays narrow and short-duration cash yields stay attractive into summer. A softer print does the opposite and pulls June cut odds forward, which squeezes the yield on your cash-equivalent allocation. The near-term question is which side of that capex gap your watchlist sits on heading into Wednesday, because the three hyperscaler prints (GOOGL, META, AMZN) on FOMC day will reprice AI infrastructure leadership by Thursday’s open, and AAPL on Thursday tells you whether Friday opens with the Cook handoff treated as a buying opportunity or an overhang.
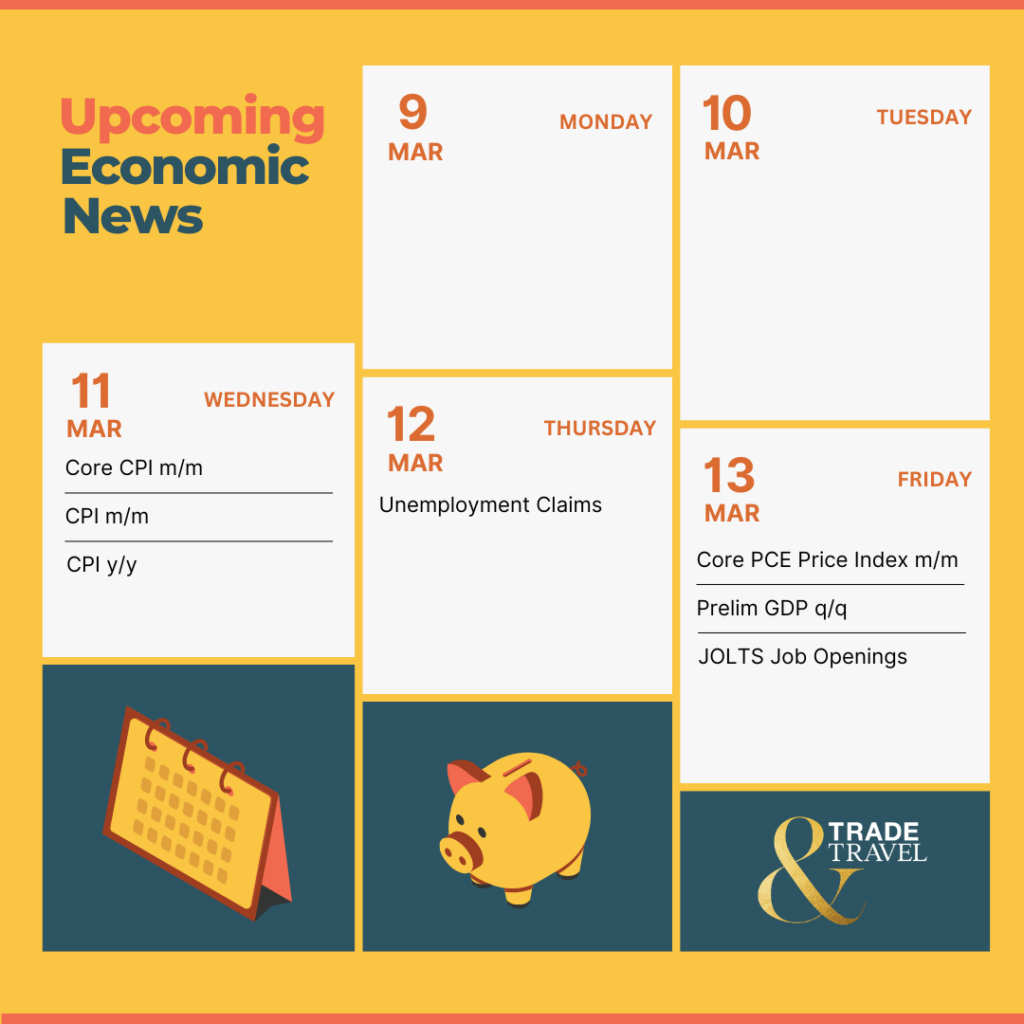
📅 Wednesday, April 29th
- Federal Funds Rate Decision (FOMC): April 2026
The Federal Open Market Committee meets on April 28-29, 2026, releasing its rate decision and policy statement on Wednesday afternoon, with Chair Jerome Powell holding the post-meeting press conference the same afternoon.
The federal funds target range governs overnight interbank lending and serves as the anchor for every consumer and business borrowing rate in the economy. The Committee has held the target range at 3.50%-3.75% since the March 17-18 meeting, where it voted 11-1 to hold with Governor Stephen Miran dissenting in favor of a 25-basis-point cut.
The latest Summary of Economic Projections penciled in a median year-end 2026 rate of 3.4%, consistent with just one quarter-point reduction, while seventeen of nineteen participants flagged upside risks to inflation. CME FedWatch placed roughly a 97.9% probability on a hold at this meeting as of April 24, with markets looking through the April gathering and pricing the earliest meaningful probability of a cut into the June 16-17 meeting. No updated Summary of Economic Projections accompanies this meeting, so the entire information content comes from the statement language and the Powell press conference.
Markets will read the statement for any softening of the “modestly restrictive” framing and watch Powell for guidance on how the Committee is weighing tariff-linked goods inflation, labor market softening, and geopolitical energy risk.
📅 Thursday, April 30th
- Advance GDP q/q: Q1 2026
The Bureau of Economic Analysis releases the Advance estimate of Q1 2026 real Gross Domestic Product. The first of three BEA estimates arrives a month after quarter-end and is the earliest comprehensive read on U.S. economic output, measuring the annualized quarter-over-quarter change in inflation-adjusted goods and services production.
The prior period baseline came in unusually soft: the third estimate for Q4 2025 showed real GDP expanding at just 0.5% annualized, revised down 0.2 percentage points from the second estimate as weaker investment offset resilient consumer spending.
Consensus calls for a sharp reacceleration to 2.2% annualized for Q1 2026, while the Atlanta Fed’s GDPNow nowcast sat at just 1.24% as of April 21, creating an unusually wide gap between Wall Street’s projection and the data-driven tracker. Component-level drivers will determine which side is closer, with personal consumption spending the largest single input and likely to show a rebound from the weather-pressured January and February prints, while net trade and inventory swings traditionally introduce the greatest quarter-to-quarter volatility.
The release also carries the Advance GDP Price Index, expected at 3.9% annualized versus 3.7% in the prior quarter, a backdoor read on pricing pressures that feeds into the Fed’s inflation assessment, with tariffs on imported goods and services inflation near 3% year-over-year. Markets will watch whether the Advance figure validates consensus reacceleration or tracks closer to GDPNow’s tepid read.
- Core PCE Price Index m/m: March 2026
The Bureau of Economic Analysis releases the March 2026 Personal Income and Outlays report, and within it the Core Personal Consumption Expenditures Price Index, which strips out volatile food and energy to isolate underlying price pressures. This is the Federal Reserve’s preferred inflation gauge, referenced explicitly in the statement that accompanies the April 28-29 FOMC decision, the day prior, and weighted more heavily by policymakers than the more widely covered CPI series.
Core PCE rose 0.4% month over month in February 2026 and 3.0% year over year, with the monthly pace matching the ten-month high even as the annual reading eased from 3.1% in January and remained well above the Fed’s 2% target, a gap that has narrowed only slowly since late 2024 and continues to underwrite Committee caution on cuts. Consensus calls for Core PCE of 0.3% month over month and 2.7% year over year for March, a deceleration from the prior month that would mark the slowest annual reading in several quarters if it holds.
At the March 18 FOMC press conference, Powell pinned roughly half to three-quarters of the core inflation reading (running near 3%) on tariff pass-through. March PCE is the first full month after the administration’s April 2 reciprocal tariff escalation was paused for 90 days on April 9, so analysts will pick apart goods versus services for evidence of whether the tariff shock is fading or quietly rotating into services prices.
- Employment Cost Index q/q: Q1 2026
The Bureau of Labor Statistics releases the Q1 2026 Employment Cost Index, which measures the change in the total cost of employing civilian workers. The most recent reading, covering Q4 2025 and released on February 10, showed civilian compensation rising 0.7% on the quarter and 3.4% over the prior twelve months, with wages and salaries up 3.3% year over year and benefit costs up 3.4%.
The annual pace has decelerated from the roughly 4% range that prevailed through 2023 but has now plateaued near 3.4% for three consecutive quarters, reflecting a labor market that is cooling without breaking. Consensus points to a Q1 2026 print of 0.8% quarter over quarter, an acceleration from the 0.7% posted sequentially, with the twelve-month figure likely to track around 3.5% if the component mix holds. bls.gov details on the 82% wages-and-salaries weight versus the 18% benefits weight, and on private-industry versus state-and-local government splits, will determine whether any upside comes from broad-based wage pressure or from benefit cost inflation tied to healthcare and paid leave mandates.
Markets will watch the private-industry component specifically, where Q4’s 0.8% sequential increase ran above the 0.7% whole-ECI reading, and any deceleration there would offer the clearest evidence that service-sector wage growth is realigning with productivity gains near 2%.
💼 The most concentrated mega-cap week of Q1 2026 earnings tests AI capex discipline, payments volume, and oil major buybacks in a single trading week.
📅 Tuesday, April 28th
- Visa (V): Q2 FY2026 (After Close)
Visa Inc. reports fiscal Q2 FY2026 results, with analyst consensus calling for EPS of $3.09 on revenue of $10.7 billion. If the EPS estimate proves accurate, it would mark a 12.0% increase over the $2.76 EPS delivered in the same quarter last year, continuing the double-digit compounding pattern that has held across recent quarters despite increasing cross-border volatility.
The $10.7 billion revenue consensus implies roughly 11.5% growth from the $9.6 billion reported a year ago, a modest step-up from the 9% net revenue growth posted in the year-ago comparable quarter and broadly consistent with the low-teens consensus trajectory for FY2026.
Analyst estimates call for total payment volume growth of 8.6% and processed transactions growth of 10%, with Gross Dollar Volume expected to rise 7% year over year; any upside to the volume line will matter more than the EPS beat because Visa’s operating leverage is largely mechanical once volumes clear. Cross-border volume is the single most scrutinized line item, and investors will watch whether the 13% constant-dollar growth posted in the year-ago quarter has held through the Q1 tariff turbulence and the administration’s 90-day reciprocal tariff pause, since travel corridors between the U.S., Europe, and Asia have shown uneven patterns since January.
The processed transactions base of roughly 60.7 billion in the year-ago quarter underscores the structural advantages of the network: each incremental transaction carries near-zero marginal cost, driving the 67% five-year average operating margin that remains the single cleanest proxy for platform economics in financial services.
Forward fee revenue is anchored by the same three drivers, data processing, service, and international transaction fees, that scaled last quarter, with the international transaction line the most sensitive to tariff-driven travel shifts; management reiterated the existing $30 billion share repurchase authorization alongside the prior print, signaling confidence in free cash flow through the macro window.
Macro themes likely to dominate the call include tariff effects on cross-border travel volumes, the competitive response to stablecoin and real-time payment initiatives, and early commentary on the network’s exposure to any FOMC pivot out of the April 28-29 meeting that could reshape consumer spending elasticity. CEO Ryan McInerney is expected to frame consumer spending as “resilient” while threading the needle on macro visibility.
📅 Wednesday, April 29th
- Alphabet (GOOGL): Q1 FY2026 (After Close)
Alphabet Inc. reports Q1 FY2026 results, with analyst consensus calling for EPS of $2.68 on revenue of $106.88 billion. If the EPS estimate proves accurate, it would mark a 4.6% decline from the $2.81 delivered in the same quarter last year, though that prior-year figure itself beat Street expectations by roughly 40%. The $106.88 billion revenue consensus implies 18.5% growth from the $90.2 billion reported a year ago, a step-up from the 12% reported growth (14% constant currency) posted in the year-ago quarter and consistent with the acceleration pattern AI infrastructure spend has unlocked across Google Cloud and Search.
Google Cloud is the single most-scrutinized line: consensus projects the segment delivered $18.40 billion in revenue, implying 50.1% year-over-year growth versus the $12.3 billion posted a year ago, which itself grew 28%; an upside print closer to $19 billion would validate the capacity expansion thesis and provide cover for the elevated capex trajectory, while any miss near $17.5 billion would reprice the sector.
Google Advertising is projected at $76.91 billion, implying roughly 15% year-over-year growth and an incremental acceleration from the Q4 cadence, while Google Search & other is modeled at $59.66 billion, implying 17.7% year-over-year growth as AI Overviews and Gemini-powered commercial queries continue to expand. The digital channel mix story centers on whether Search monetization is durable against ChatGPT and generative competition: the rollout of Gemini 2.5 across core Google surfaces last quarter shaped pricing discipline in the ads business, and the call will be parsed for any commentary on query trends, click-through rates, and enterprise Gemini penetration in Workspace.
Forward stakes rest on the capex guidance: management’s prior framework pointed to a meaningful step-up in 2026 capital expenditures, and whether the Q1 pace justifies or stretches that envelope will directly impact free cash flow projections for the second half. Macro themes likely to dominate the call include antitrust relief or risk following the DOJ remedies phase, the contribution of Waymo and other Other Bets to the margin story, and tariff-adjacent questions about hardware and data center supply chain exposure. CEO Sundar Pichai is expected to anchor commentary around the “full stack approach to AI.”
- Meta Platforms (META): Q1 FY2026 (After Close)
Meta Platforms, Inc. reports Q1 FY2026 results, with analyst consensus calling for EPS of $6.73 on revenue of $55.46 billion. If the EPS estimate proves accurate, it would mark a 4.7% increase over the $6.43 delivered in the same quarter last year, modest growth that reflects the weight of accelerating AI capital expenditures offsetting the operating leverage of the advertising business.
The $55.46 billion revenue consensus implies 31% growth from the $42.31 billion reported a year ago, a meaningful step-up from the 16% growth posted in the year-ago quarter and consistent with the double-digit pricing and impressions narrative the ad-tech business has sustained through the Reels and Advantage+ monetization stack.
Advertising revenue, the dominant line, is projected at $53.93 billion, roughly 30% higher year over year and consistent with eMarketer’s forecast that Meta will surpass Google in 2026 global digital ad revenue at $243.46 billion versus Google’s $239.54 billion, a milestone that would cement AI-driven performance advertising as the single most consequential wedge of platform monetization. The user and engagement story remains stable: Meta AI crossed nearly one billion monthly active users in the year-ago quarter, and investors will watch commentary on time spent, Reels engagement, and WhatsApp Business monetization progress, metrics that underwrite the durability of the 30% advertising acceleration.
Capital expenditure is the single most scrutinized number in the release: management raised the 2026 capex framework to roughly $135 billion on the fourth-quarter call, with Zuckerberg prioritizing data center buildout and AI infrastructure, and any upward revision from this print, or commentary on 2027 capex trajectory, would dominate the post-print reaction even if revenue beats.
Reality Labs remains a structural drag, losing $4.2 billion on $412 million in revenue in the year-ago quarter, and investors will look for any commentary on Meta AI glasses traction that could improve the unit economics over time. Macro themes likely to dominate the call include whether AI-monetized ad inventory can continue to justify the $135 billion capex pace, enterprise uptake of Meta AI, and the tariff passthrough risk on imported hardware for data center construction. CEO Mark Zuckerberg is expected to frame capital intensity against the long-term AI infrastructure advantage.
- Amazon (AMZN): Q1 FY2026 (After Close)
Amazon.com, Inc. reports Q1 FY2026 results, with analyst consensus calling for EPS of $1.62 on revenue of $177.27 billion. If the EPS estimate proves accurate, it would mark a modest 1.9% increase over the $1.59 delivered in the same quarter last year, a significant deceleration from the 62.2% year-over-year leap posted in the year-ago quarter and reflective of the operating leverage compression tied to accelerating AI infrastructure capital outlays.
The $177.27 billion revenue consensus implies roughly 13.9% growth from the $155.67 billion reported a year ago, slightly below last quarter’s 14% pace but consistent with the durable mid-teens trajectory management has steered since mid-2024.
AWS is the single most-watched line, with consensus pointing to roughly $36.8 billion in segment revenue, implying 25.6% growth from the $29.3 billion a year ago, a meaningful acceleration from the 17% year-ago pace that turned on capacity coming online to meet AI training and inference demand. Any print above $37 billion would validate the capital intensity underwriting the AI buildout, while a miss near $36 billion would reprice the group.
The AWS operating margin is consensus-modeled at 35.7%, down from the 39% AWS margin reported a year ago, when the combination of longer server useful lives and cost discipline compounded into record segment profitability, and investors will parse the gap for evidence that AI training workloads carry lower through-cycle margins than traditional cloud compute. CEO Andy Jassy’s April disclosure of a $15 billion annualized AI revenue run-rate and roughly $20 billion chips business pace underwrites the AWS growth narrative, and commentary on Trainium2 adoption and enterprise AI workload migrations will shape modeling for the second half.
Forward capital expenditure (capex) is the swing variable: the 2026 capex framework is approaching $200 billion, and whether the Q1 pace is consistent with that envelope, or tracking hotter, will determine the narrative around free cash flow compression and the durability of the 11.8% operating margin posted in the year-ago quarter. Macro themes likely to dominate the call include retail advertising growth, which expanded roughly 22% in the year-ago quarter, tariff exposure on third-party seller goods, U.S. retail pricing, and the impact of higher shipping costs tied to the Strait of Hormuz oil complex flare-up earlier in April. Jassy is expected to frame the capex pace against long-term AI revenue scaling.
📅 Thursday, April 30th
- Eli Lilly (LLY): Q1 FY2026 (Before Open)
Eli Lilly and Company reports Q1 FY2026 results, with analyst consensus calling for EPS of $7.33 on revenue of $17.61 billion. If the EPS estimate proves accurate, it would continue the multi-quarter double-digit earnings expansion pattern that has accompanied the launch curves for Mounjaro and Zepbound, the company’s tirzepatide-based GLP-1 franchises.
The $17.61 billion revenue consensus implies roughly 38% growth from the same quarter last year, consistent with the prescription trend data that has shown Zepbound volumes sustaining a rapid expansion through the first quarter despite supply normalization and the wind-down of compounded tirzepatide alternatives.
The leading indicator most relevant to the print is weekly prescription scan data, and the company’s own reported Mounjaro and Zepbound revenue trajectories, which have tracked ahead of Street models on both obesity and Type 2 diabetes indications; any commentary on Zepbound direct-to-consumer LillyDirect uptake and pricing-per-vial economics will shape models for the back half.
Orforglipron, the company’s oral GLP-1 candidate, has an anticipated mid-2026 PDUFA decision following filing acceptance, with Phase 3 obesity data showing weight loss up to roughly 12% at the highest dose, and any regulatory or commercial timeline commentary will be a second-order driver. The oral format could meaningfully broaden addressable demand once approved. The direct-to-consumer story centers on LillyDirect and employer formulary wins, where traction through Q1 partners will feed into sustained 2026 topline growth.
Forward guidance is the swing variable: management has guided 2026 revenue to $80-83 billion and EPS of $33.50-35, and any upward revision from the Q1 print would confirm the durability of the launch curve through competitive Wegovy pricing pressure and upcoming Medicare negotiation exposure. Macro themes likely to dominate the call include the Inflation Reduction Act Medicare price negotiation implications for 2027 and beyond, tariff exposure on API sourcing, and competitive dynamics as Novo Nordisk’s Wegovy and other entrants contest the GLP-1 category; management has consistently framed the category as capacity-constrained, and continued evidence of that framing would support the premium multiple. CEO David Ricks is expected to anchor commentary around manufacturing capacity buildout and next-gen GLP-1 candidates.
- Apple (AAPL): Q2 FY2026 (After Close)
Apple Inc. reports fiscal Q2 FY2026 results, with analyst consensus calling for EPS of $1.91 on revenue that Visible Alpha consensus places at $109.3 billion. If the EPS estimate proves accurate, it would mark a 15.8% increase over the $1.65 delivered in the same quarter last year, extending the post-launch acceleration that management has framed as the clearest evidence of iPhone and Services compounding. The $109.3 billion revenue consensus implies roughly 14.6% growth from the $95.4 billion reported a year ago, landing within the company’s own guidance range of 13% to 16% year-over-year growth and marking one of the stronger Q2 growth prints in the post-pandemic era.
The leading indicator most relevant to the print is iPhone revenue, projected at $56.5 billion, reflecting sustained demand through the March quarter and the tailwind from an expanded Apple Intelligence rollout to additional languages and markets since the iOS 26.1 release.
The channel mix story centers on Services, projected to contribute roughly $30 billion at an operating margin north of 70%, the single cleanest line-item driver of gross margin accretion; App Store, advertising, Apple TV+, and iCloud subscription growth have each tracked positively through the quarter, and investors will watch commentary on China revenue specifically, where geopolitical and tariff exposure has been most scrutinized.
This report carries an unusual weight: on April 20 Apple announced that Tim Cook will step down as CEO effective September 1, 2026, with Senior Vice President of Hardware Engineering John Ternus named successor, and Cook transitioning to Executive Chairman; the April 30 report is the first earnings call after the announcement and the last fiscal Q2 print of Cook’s 15-year tenure as CEO, and investors will watch for any formal handoff framing or capital allocation signals heading into the transition.
Forward services and installed base commentary from Ternus, scheduled to assume the CEO role on September 1, may surface even without a formal transition discussion, and the Street will parse it carefully. Macro themes likely to dominate the call include tariff exposure, given the administration’s April 2 reciprocal tariff policy, China revenue trajectory, Apple Intelligence feature rollout pace, including region-by-region availability, and any commentary on forward iPhone unit expectations heading into the June WWDC and fall product cycle. CEO Tim Cook, with CFO Kevan Parekh, is expected to frame the quarter against the transition.
📅 Friday, May 1st
- ExxonMobil (XOM): Q1 FY2026 (Before Open)
Exxon Mobil Corporation reports Q1 FY2026 results, with analyst consensus calling for EPS of $1.21 on revenue of $81.13 billion. If the EPS estimate proves accurate, it would mark a 31.3% decline from the same quarter last year, with consensus having been revised 81.97% higher over the trailing 30 days as analysts reassessed the pace of downstream margin recovery and upstream price realizations for the March quarter.
The $81.13 billion revenue consensus reflects the blended impact of flat year-over-year Brent and WTI prices against modest production gains from the Guyana and Permian ramp that have anchored the upstream growth narrative; Exxon’s Guyana production continues to step higher with the fifth FPSO on track for 2026 startup, and Permian volumes remain supported by the Pioneer integration synergies.
Exxon’s leading indicator most relevant to the print is crude realizations: average Brent and WTI prices during Q1 traded broadly in line with the year-ago quarter but materially below the mid-2024 peak, while gas prices and product crack spreads have been uneven; the per-barrel result flows directly into upstream after-tax earnings, which have historically driven more than 60% of segment profit variance.
The downstream channel mix story centers on refining, where first-quarter product cracks held near multi-year averages despite seasonal turnarounds, and on lubricants and chemicals, both of which have shown margin recovery off cyclical troughs. Investors will scrutinize Product Solutions segment commentary for evidence that the $20 billion cumulative structural cost savings program targeted through 2030 remains on track, with roughly $13.5 billion already delivered versus the 2019 baseline. Customer health in the chemicals complex has shown tentative stabilization heading into the quarter, and management has held the $17.5 billion full-year capex target that underwrites the production growth envelope and buyback pace.
Forward commentary on buybacks and the dividend matters most: Exxon has guided $20 billion in 2026 share repurchases, a pace that requires upstream cash generation well above the corporate cash breakeven, and any re-guidance would carry more weight than the Q1 headline given the beat-streak pattern (four consecutive beats entering the print).
Macro themes likely to dominate the call include OPEC+ supply discipline, Middle East geopolitical risk and Strait of Hormuz shipping costs, tariff exposure on imported petrochemical feedstocks, and commentary on the Guyana ramp schedule after recent Venezuela boundary tensions. CEO Darren Woods is expected to anchor commentary around the structural cost program and Guyana growth.
We hope this helps and happy trading! 💼
The Trade and Travel Team
Related Blogs


Follow Us
Testimonials
Hear from students on why they chose the Trade and Travel Family and how it has changed their lives.

