
The stock market endured a challenging week as market participants wrestled with valuation concerns and shifting Federal Reserve expectations, despite significant positive developments on the government shutdown resolution and strong earnings from the semiconductor sector. For the week, the S&P 500 (SPY) declined 1.92%, the Nasdaq (QQQ) dropped 3.09%, and the Dow Jones Industrial Average (DIA) fell 1.83%.
The week’s headline development came with the conclusion of the historic 43-day federal government shutdown, the longest in U.S. history. President Trump signed funding legislation on November 12 that extends government operations through January 30, 2026. Estimates of the number of furloughed employees range from around 670k to over 900k. The shutdown’s end marked a critical step toward normalizing federal operations, though economists estimate the closure cost between $7 billion and $14 billion in lost productivity.
The week’s most anticipated event came on Wednesday evening when Nvidia reported fiscal third-quarter results that exceeded already lofty expectations. The AI chip giant posted revenue of $57 billion, up 62% year-over-year, and net income of $31.9 billion, representing a 65% annual increase. The company’s data center segment, which powers artificial intelligence applications, generated a record $51.2 billion in revenue. CEO Jensen Huang declared that Blackwell chip sales were “off the charts.”
Despite Nvidia’s blockbuster results, the market’s reaction proved volatile and ultimately disappointing. After an initial surge Thursday morning, stocks reversed sharply intraday in what marked the most intense hour-to-hour fluctuations since April.
Federal Reserve policy uncertainty emerged as a dominant theme, with officials sending mixed signals about the December meeting. Minutes from the October FOMC meeting revealed significant divisions among policymakers, with “many” participants suggesting rates should remain unchanged for the remainder of the year, while “several” supported another quarter-point cut in December. The uncertainty intensified when the Bureau of Labor Statistics postponed the release of October’s consumer price index data until December 18, after the Fed’s decision, depriving policymakers of crucial inflation information.
The labor market has shown continued signs of softening, reinforcing the case for potential monetary easing. The U.S. unemployment rate rose to 4.4%, the highest level in over four years. While job gains continued, recent data revealed slower employment growth and a rising jobless rate. Federal Reserve Governor Christopher Waller publicly cited weakening labor conditions as a reason to support a rate cut at the upcoming December meeting. This labor market moderation, alongside signs of continued but mixed economic growth, has created a challenging environment for monetary policymakers as they weigh inflation control against employment support.
Looking ahead to the holiday-shortened week, traders should prepare for potentially heightened volatility amid thin trading conditions. U.S. markets will close for Thanksgiving on Thursday, November 27, and operate only until 1:00 p.m. Eastern on Friday, November 28.
How This Impacts You
With recent market swings and policy uncertainty in the headlines, this might be a good time to become more familiar with how the stock market actually works, especially in the tech sector, where dramatic shifts have drawn attention. Even without diving in, spending some time learning how to read a stock chart can help you feel more in control and better prepared when opportunities arise.
Note: Some economic data releases remain on hold, and tentative releases are not included here.
📅 Tuesday, Nov 25th
- Core PPI m/m: The Core Producer Price Index m/m is scheduled for release, with the previous reading showing a decline of 0.1%. This upcoming report will be closely watched as market participants assess whether wholesale price pressures are continuing to moderate.
Market participants should focus on whether core PPI returns to positive territory or remains deflated, as a stronger-than-expected reading above 0.2% forecast levels could reignite inflation concerns and potentially delay anticipated rate cuts, while a softer outcome would reinforce the disinflationary narrative. The core PPI reading carries particular weight because it excludes volatile food and energy components, providing clearer signals of underlying pricing pressures that businesses face and may subsequently pass to consumers through higher service prices over the coming months.
- PPI m/m: The U.S. Producer Price Index is scheduled for release, following August’s 0.1% monthly decline that marked a significant pullback from July’s 0.9% surge. Headline PPI is expected to remain relatively subdued, with investors closely watching whether price pressures at the wholesale level are moderating or if they could signal renewed inflation momentum.
A headline PPI result stronger than expectations could stoke Fed tightening concerns and pressure equity markets, while a softer-than-forecast reading would likely support the narrative of inflation gradually approaching the Federal Reserve’s 2% target. Markets will use September’s PPI data as a critical barometer of upstream inflationary pressures before December’s FOMC meeting, with particular attention to services inflation given that sector comprises roughly 80% of GDP.
- Core Retail Sales m/m: The U.S. Core Retail Sales m/m report measures month-over-month changes in retail spending excluding volatile auto and fuel categories, with the prior month showing a 0.7% increase that reflected steady consumer demand.
The prior reading demonstrated resilience in household spending, though any significant divergence from this level could signal shifts in consumer confidence and discretionary purchasing power amid persistent economic uncertainty. The data’s impact extends beyond consumer stocks, as weakness or strength in this metric can trigger broad repricing across asset classes and reshape market expectations for Federal Reserve policy action through the remainder of the year.
- Retail Sales m/m: The U.S. Census Bureau is set to release the September 2025 Retail Sales report, following August’s robust 0.6% month-over-month gain. That increase reflected strong consumer activity toward the end of summer and contributed to broader economic momentum.
The upcoming release will provide further insight into the strength of consumer demand and its durability heading into the holiday season and Q4. Because retail sales data serve as a key gauge of consumer behavior, significant movements in the report can influence equity markets, particularly consumer-discretionary and retail sectors, and shape market expectations for future Federal Reserve policy decisions.
📅 Wednesday, Nov 26th
- Unemployment Claims: The U.S. Department of Labor reported 220,000 initial jobless claims for the week ending November 15, a decrease of 8,000 from the previous week and below the consensus estimate of 227,000. This decline suggests that layoffs remain relatively low, indicating continued resilience in the labor market.
The report holds particular importance as it is one of the final real-time labor market indicators available before the Federal Reserve’s December 9 to 10 policy meeting. Investors are watching closely for any shifts in employment conditions that could influence the central bank’s decision-making.
Continuing claims, which measure the number of people receiving unemployment benefits, rose to 1.974 million. This is the highest level since 2021 and suggests that while layoffs are limited, workers are facing more difficulty securing new employment. The divergence between low initial claims and rising continuing claims highlights a labor market that is stable but showing signs of cooling in job creation.
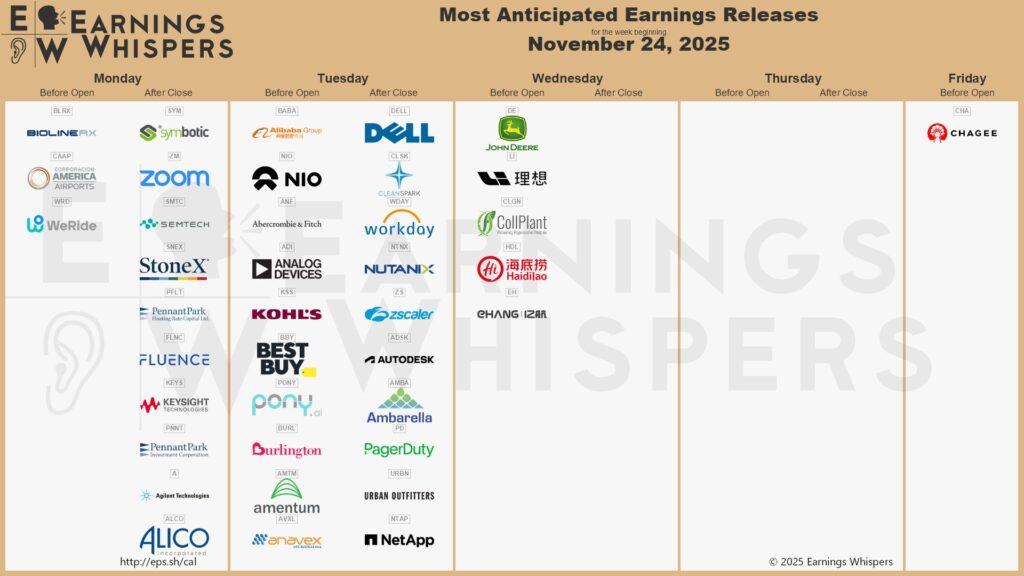
💼 It is a lighter earnings week in the U.S., but the companies reporting across technology and consumer sectors will still play a key role in shaping how the market reads the economy.
📅 Monday, Nov 24th
- Zoom Communications, Inc. (ZM): Zoom Communications is set to report Q3 fiscal 2026 results, with investors focusing on whether the company can maintain modest revenue growth amid enterprise headwinds and AI monetization challenges. Wall Street expects revenues of $1.21 billion, representing 2.5% year-over-year growth, with earnings per share of $1.44, representing a 4.34% growth compared to the year-ago quarter.
The company has raised its full-year fiscal 2026 revenue guidance to $4.825-$4.835 billion. A critical area to monitor is AI monetization, particularly around AI Companion 3.0 unveiled at Zoomtopia in September, which includes agentic AI capabilities at no additional cost to paid users, though meaningful revenue contributions aren’t expected until fiscal 2027.
Zoom Phone reached 10 million seats globally in September, marking a significant milestone for its enterprise segment since the product’s 2019 launch, with customers reporting cost savings up to 81%. The company’s Zoomtopia announcements also included a strategic partnership with Oracle involving a 15,000-seat contact center deployment, and collaboration with NVIDIA to integrate Nemotron large language models into Zoom’s AI architecture, both positioning the company for competitive advantage in enterprise-focused deployments.
Analysts will scrutinize guidance for fiscal Q4 and full-year updates, particularly around enterprise customer counts and the trajectory of high-value customers generating over $100,000 in annual recurring revenue, as these metrics historically signal demand strength. Market participants should also watch management commentary on enterprise adoption pipeline, and AI Companion 3.0 traction metrics.
- Keysight Technologies Inc. (KEYS): Keysight Technologies is scheduled to report Q4 fiscal 2025 results, with consensus estimates pointing to revenue of $1.38 billion, representing 6.9% year-over-year growth, and adjusted earnings per share of $1.83, up 10.9% from the $1.65 reported in the prior year quarter.
The company has demonstrated strong performance over the past year, posting a trailing four-quarter average earnings surprise of 4.71%. Its business is structured into two main segments: Communications Solutions Group (CSG) and Electronic Industrial Solutions Group (EISG), with CSG accounting for approximately 70% of total company revenue. Investors should monitor whether the Communications Solutions Group meets revenue expectations near $965.2 million, as it remains the company’s core growth engine, supported by demand for next-generation communications infrastructure and automotive testing solutions.
The Electronic Industrial Solutions Group reported $412 million in revenue for Q3 2025, representing an 11% year over year increase. This growth is supported by secular tailwinds in semiconductor testing, general electronics, automotive, and energy applications. Management’s recently completed acquisitions, including Spirent Communications, the Optical Solutions Group from Synopsys, and PowerArtist from Ansys, are expected to be accretive to earnings and may influence guidance for the coming year. Commentary on the integration of these assets will be closely watched by traders as a signal of execution strength and strategic alignment.
A key question for the earnings call will be how the company is navigating macroeconomic uncertainty and customer spending hesitation, which management flagged as headwinds affecting near-term growth prospects across several regions. Traders should pay particular attention to the quantum systems and next-generation semiconductor design capabilities highlighted in recent product launches, as these emerging markets could provide insight into long-term competitive positioning and future revenue drivers beyond traditional test and measurement markets.
- Fluence Energy, Inc. (FLNC): Fluence Energy is scheduled to report Q4 fiscal year 2025, with investors closely watching the company’s ability to meet ambitious guidance following significant production headwinds. Analysts expect the company to post a consensus EPS of $0.19, representing a sharp 44.1% decline from $0.34 in the prior-year period.
Throughout the fiscal year, the company has revised its full-year revenue guidance downward on more than one occasion. The company first initiated guidance in November 2024 at a higher range of $3.6–$4.4 billion. It was later lowered in February 2025 to $3.1–$3.7 billion, which was largely attributed to delays in signing specific contracts in Australia. Finally, in May 2025, Fluence revised its guidance to the current $2.6–$2.8 billion range, citing a slower-than-expected ramp-up at its newly commissioned U.S. manufacturing facilities. This slower production shifted some anticipated revenue to the next fiscal year.
For the quarter, analysts project revenues of approximately $1.39 billion, marking a 13% year-over-year increase driven by continued strength in energy storage deployments, with deployment volumes expected to reach 7,796 megawatts compared to 5,000 megawatts in the prior year, a 56% increase showcasing robust market demand. The company’s critical backlog stands at $4.9 billion as of the latest quarter-end, up 8.9% year-over-year, though order intake momentum and pipeline strength will be scrutinized by investors to gauge future revenue visibility and growth acceleration beyond FY2025.
Tariff headwinds remain a significant wildcard, with Section 301 tariffs on Chinese lithium-ion batteries set to rise from 7.5% to 25% effective January 1, 2026; however, Fluence’s diversified supply chain strategy should help mitigate margin compression on new contracts. Gross profit margin trends warrant close attention, as investors should assess whether the company can maintain double-digit adjusted gross margins amid tariff impacts on legacy contracts and competition from lower-cost competitors while benefiting from accelerating AI data center power demand.
📅 Tuesday, Nov 25th
- Best Buy Co., Inc. (BBY): Best Buy will report its Q3 fiscal 2026 earnings, with Wall Street expecting earnings per share of $1.31, representing 4% year-over-year growth, and revenue of $9.58 billion, up 1.4% from the prior-year quarter.
The consensus EPS estimate has been revised upward 0.4% over the past month, signaling that analysts have grown slightly more optimistic about the company’s quarterly performance heading into the report. Investors should focus closely on the company’s gross profit rate trajectory, as the domestic segment has faced margin pressure from a higher sales mix in lower-margin categories like gaming and computing, though services categories have provided some offset.
The company maintains full-year fiscal 2026 guidance for revenue between $41.1 billion and $41.9 billion with comparable sales growth in the range of down 1% to up 1%, but tariff impacts remain a critical wildcard. Comparable sales will be a crucial metric to watch, particularly as Best Buy navigates holiday season demand amid broader consumer caution driven by tariff-related price increases and declining consumer confidence.
The marketplace expansion and vendor partnerships remain key strategic initiatives to monitor for potential upside, as the company recently launched Best Buy Marketplace in an effort to drive digital growth and enhance revenue streams.
International revenue growth warrants attention, as the segment has shown stronger momentum with comparable sales up 7.6% in Q2 and new Best Buy Express locations in Canada contributing meaningfully to expansion. Finally, any updates on holiday guidance for Q4 will be critical, as consumer spending trends and price sensitivity during the peak retail season will heavily influence full-year results and investor sentiment for fiscal 2026.
- Burlington Stores, Inc. (BURL): Burlington Stores is scheduled to report its Q3 fiscal 2025 earnings, with investors closely watching whether the company can extend its track record of positive surprises. Analysts expect earnings per share of $1.64, representing modest 5.8% year-over-year growth, with revenues projected at $2.72 billion, up 7.5% from the prior year.
The critical metric for traders will be comparable store sales, with management guiding in the range of flat to up 2%. This represents a slowdown from the company’s reported 5% comparable store sales increase in Q2 fiscal 2025. In Q3 fiscal 2024, Burlington reported a comparable store sales increase of 1%. Burlington’s strong execution on its Burlington 2.0 strategic initiative, featuring modernized store layouts, enhanced merchandising systems, and improved supply-chain efficiency, has been the primary driver of profitability improvements, and this quarter will test whether those operational gains can sustain momentum against tariff headwinds and consumer spending pressures.
Gross margin has shown modest improvement in 2025, with Burlington reporting 43.8% in Q1 and about 43.6% to 43.7% in Q2. These year-over-year gains were supported by stronger merchandise margins, faster inventory turns, and lower freight costs. While last year’s Q3 delivered a larger uplift of roughly 70 basis points, the margin expansion in 2025 has been smaller, and investors will be watching to see whether these steady gains can continue as the year moves forward.
Management has stated that import-related tariffs remain a significant cost headwind for the back half of the year, and they expect to offset much of this pressure through cost actions, vendor negotiations, and adjustments to merchandise mix. As a result, maintaining margin performance remains an important area of focus.
We hope this helps, and we’re wishing everyone a happy Thanksgiving! 🦃
– Trade and Travel Team
Related Blogs


Follow Us
Testimonials
Hear from students on why they chose the Trade and Travel Family and how it has changed their lives.

