
Last week reminded investors why they can never afford to look away. A geopolitical shock, a weak jobs report, and rising oil prices all hit in the same week, leading to one of the steepest market declines of the year.
The S&P 500, as tracked by SPY, fell approximately 1.5% on the week. The Dow Jones Industrial Average, as tracked by DIA, dropped roughly 1.8%, and the technology-heavy Nasdaq, as tracked by QQQ, shed about 1%, though tech held up relatively better as investors rotated toward growth names seen as less exposed to energy and trade disruption.
The catalyst that started it all landed over the weekend before markets even opened Monday. A joint U.S.-Israeli military strike on Iran sent shock waves through global commodity markets, lifting West Texas Intermediate crude oil above $90 per barrel by week’s end, its biggest weekly gain since oil futures trading began in 1983. Energy stocks surged while airlines, consumer discretionary, and rate-sensitive sectors absorbed the pressure. The initial Monday session saw a sharp dip followed by a partial recovery as investors debated whether the geopolitical premium in oil would prove durable or fade once the situation stabilized.
On Friday morning, the February nonfarm payrolls report showed the U.S. economy shed 92,000 jobs for the month, a miss against consensus expectations calling for a roughly 55,000-job decline, and the unemployment rate ticked up to 4.4%. Combined with a mid-week announcement that the administration’s 15% global tariff framework would move toward implementation, all three major averages finished negative for the week and are now in the red for 2026.
Earnings season continued to play out in the background, with a mix of technology, retail, and healthcare names reporting, offering a largely constructive picture for corporate fundamentals. The question heading into this week is how resilient those fundamentals prove to be once oil, tariffs, and a softening labor market start showing up in guidance.
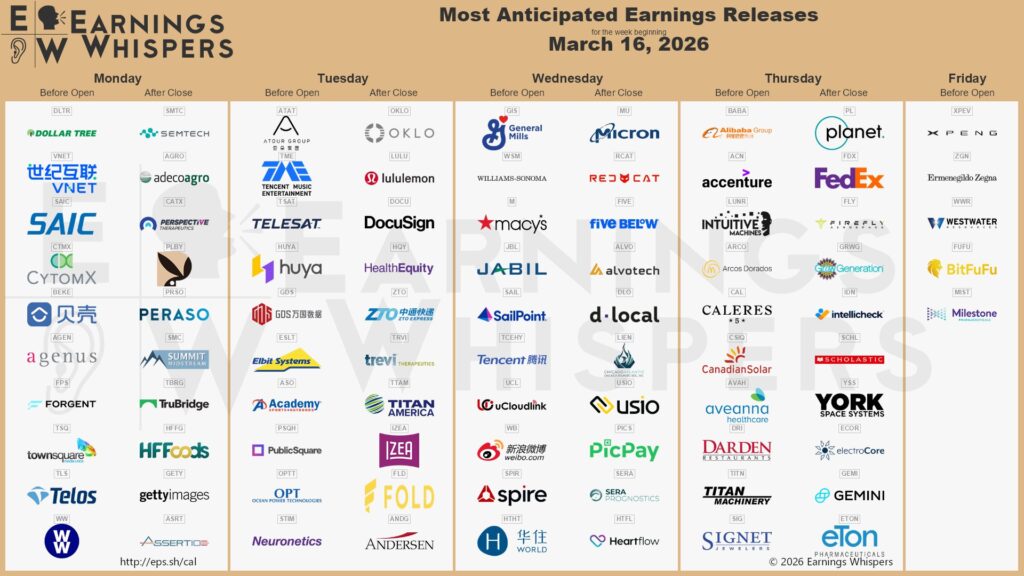
The macro calendar is dense with the Federal Reserve announcing its rate decision Wednesday, with markets watching not just the hold, which is near-certain, but the updated dot plot and Chair Powell’s tone on stagflation risk. PPI data lands the same morning, and the initial jobless claims report follows on Thursday. Layered on top of that, some of the week’s most closely watched earnings, including Micron, Nike, Accenture, Lululemon, and General Mills, among them, will test whether corporate confidence is as durable as the recent beat rates have implied.
How This Impacts You
With rising oil prices, new tariffs, and a softer job market entering the picture, the market may continue to move in unpredictable ways in the short term. For you, this could be a reminder that global events often create both risk and opportunity in the market.
Instead of trying to predict every headline, you might focus on getting a basic understanding of how sectors like energy, technology, and consumer companies respond to these shifts. Even spending a small amount of time each week reviewing major market trends could help investing feel less overwhelming and help you feel more confident about where your money goes in the future.
📅 Tuesday, Mar 18th
- Producer Price Index (PPI): The BLS releases the February 2026 Producer Price Index, delayed six days by the 2026 lapse in federal appropriations, measuring price changes received by domestic producers across final demand goods, services, and intermediate demand stages.
January 2026 delivered a broad upside shock: headline PPI rose +0.5% month-over-month (beating the +0.3% Dow Jones consensus) and +2.9% year-over-year, while core PPI, excluding food, energy, and trade services, surged +0.8% month-over-month (more than double the +0.3% forecast) and +3.6% year-over-year.
January’s composition exposed a stark goods-services split: final demand services advanced +0.8%, the largest monthly gain since July 2025, led by a +14.4% surge in professional and commercial equipment wholesaling margins and a +2.5% rise in trade services, while final demand goods declined -0.3% as a -5.5% plunge in gasoline masked core goods strength of +0.7% and a +4.8% climb in nonferrous metals, with tariff pass-through evident in apparel, chemicals, and intermediate components.
Markets will watch whether January’s +0.8% core print was a one-off distortion in volatile trade services margins or the start of a new trend. A February reading above +0.3% core m/m would reinforce the higher-for-longer narrative and pressure rate-sensitive equities and long bonds, while a print at or below +0.2% could revive rate-cut expectations.
- Federal Funds Rate (FOMC Decision): The Federal Open Market Committee releases its Federal Funds Rate decision, FOMC Statement, and updated Summary of Economic Projections (“dot plot”) on the final day of the March 17–18 meeting, with Chair Jerome Powell’s press conference.
The federal funds rate is the overnight interbank benchmark anchoring borrowing costs across mortgages, corporate debt, and global capital markets. At its last meeting, the Committee held the target range at 3.50%–3.75%, pausing after three consecutive 25-basis-point cuts in 2025; the statement characterized inflation as “somewhat elevated” and job gains as having “remained low” while pledging to “carefully assess incoming data, the evolving outlook, and the balance of risks,” though dissenting members Christopher Waller and Stephen Miran argued policy remains “meaningfully restrictive” with labor market risk as the dominant concern.
The rate decision is near-certain with CME FedWatch places the hold probability at ~94–96%, making the real variable the updated dot plot: December 2025’s SEP projected a median of one 2026 cut, and markets will watch whether March’s revision shifts toward the two-cut (June + September) path Goldman Sachs and Morgan Stanley forecast or holds at J.P. Morgan’s single-cut summer 2026 call.
Tariffs are the core complicating factor: January 2026 FOMC minutes confirmed goods inflation had been “boosted by the effects of tariff increases” while projecting those pressures would “likely start to diminish” in 2026, yet unemployment trending toward 4.3%–4.5% and DOGE-related workforce uncertainty sharpen the dual-mandate bind PIMCO described as “no risk-free path” between inflation and employment.
Investors will parse whether Powell reaffirms his December 2025 framing of tariff prices as “likely one-time level adjustments” or signals more durable inflation concern; a hawkish surprise, fewer projected cuts, dismissal of employment risk, would steepen yields and lift the dollar, while a dovish shift, two or more 2026 cuts with stagflation-risk language, would rally rate-sensitive equities and weaken the dollar ahead of the next FOMC meeting on May 6–7.
📅 Wednesday, Mar 19th
- Initial Jobless Claims: The U.S. Department of Labor releases Initial Jobless Claims for the week, a weekly tally of first-time unemployment insurance applications filed with state agencies, the highest-frequency real-time gauge of U.S. layoff activity, and is the first print plausibly capable of capturing UCFE filings from federal workers whose 30-to-60-day paid administrative leave buffers, granted under DOGE-directed reductions in late January, have begun to expire.
The most recent prior reading, 213,000 for the week ending March 7, matched the 213,000 for the week ending February 28 and edged only slightly above the 212,000 for the week ending February 22, three consecutive prints that leave the 4-week moving average at 215,750; continuing claims for the week ending February 28 rose 46,000 to 1,868,000, a lagging signal that displaced workers are staying longer in the Unemployment Insurance system.
The broader market backdrop is a “low-hire, low-fire” stasis: layoff rates have held near historically depressed levels for the better part of the past year, even as hiring has cooled, with tariff uncertainty and federal-contractor ripple effects adding drag to a sluggish demand environment.
A reading near the prevailing 212,000–213,000 range would suggest the admin-leave lag is still masking federal separations, while a move above 220,000, especially with a concurrent UCFE uptick, would be the first measurable evidence that the federal workforce shock is reaching headline claims, with direct implications for Fed rate-cut timing and cyclically sensitive sectors.
💼 Earnings season continues this week with results spanning retail, food, tech, and consulting as markets look for clues on where the economy stands heading into Q2.
📅 Tuesday, Mar 17th
- lululemon athletica inc. (LULU): lululemon is scheduled to report its fiscal Q4 2025 results, with analyst consensus projecting earnings of $4.74 per share on net revenue of approximately $3.58 billion. Should estimates prove accurate, it would represent a 22.8% year-over-year decline from the $6.14 per share delivered in the same quarter last year, driven by roughly 410 basis points of combined tariff and de minimis headwinds that management has quantified as a $320 million drag on operating margins. On the top line, the $3.58 billion estimate implies a 0.8% year-over-year decline.
The most critical KPI will be U.S. comparable sales: Americas comps fell 5% in Q3 FY2025, and the Americas segment, which generated $2.8 billion or 77% of Q4 FY2024 revenue, faces continued headwinds from softening premium consumer sentiment and intensifying competition from Alo Yoga and Vuori, whose inroads have claimed a measurable portion of lululemon’s domestic customer base.
Offsetting domestic softness, China Mainland revenue surged 46% in Q3 FY2025 with comparable sales rising 25% and management guiding China at or above the high end of its 20% – 25% full-year growth range, positioning it as the highest-conviction growth engine ahead of a record 2026 franchise expansion into six new international markets.
A decisive governance overhang shapes the earnings setup: CEO Calvin McDonald stepped down effective January 31, 2026, with CFO Meghan Frank and Chief Commercial Officer André Maestrini serving as interim co-CEOs under Executive Chair Marti Morfitt, a leadership vacuum compounded by founder Chip Wilson’s proxy campaign nominating three independent directors.
Gross margin is the key profit watch with Q4 FY2024’s 60.4% compressed to 55.6% by Q3 FY2025 (last quarter), a 480-basis-point deterioration, with further pressure from Vietnam-sourced product facing a 46% tariff and China-sourced goods at 54%, given that approximately one-third of lululemon’s production originates in Vietnam.
📅 Wednesday, Mar 18th
- General Mills, Inc. (GIS): General Mills is scheduled to report its fiscal Q3 2026 results, with Wall Street consensus projects earnings of approximately $0.82 per share on revenue of approximately $4.51 billion, implying a year-over-year EPS decline of roughly 18%. That year-ago quarter itself represented a 15% constant-currency decline, underscoring that General Mills has now cycled through two consecutive years of bottom-line compression as CEO Jeff Harmening executes a costly pivot, cutting prices across roughly two-thirds of the North America Retail portfolio, reinstating promotional intensity, and absorbing higher incentive compensation normalization, to claw back volume lost to private-label alternatives.
The $4.51 billion revenue estimate represents a decline of approximately 7% year over year, consistent with the 7% net sales decline posted in the last quarter when net sales came in at $4.9 billion, and reflects ongoing portfolio reshaping, including the net drag from prior-year divestitures.
The North America Retail segment registered organic volume growth for the first time in more than four years, with snacks brands including Chex Mix and fruit snacks each posting high-single-digit retail pound growth and Nature Valley Protein Granola accelerating nearly 20% in Nielsen-measured pound growth, even as North America Retail organic net sales still declined 3% overall due to the price investment headwind.
The segment mix entering Q3 shows meaningful divergence: North America Retail remains the largest business but faces continued pricing pressure; the Pet segment, anchored by Blue Buffalo, returned to organic sales growth in Q2, led by cat food and treats with Tastefuls and Tiki Cat driving mid-single-digit category growth, while the newly launched Blue Buffalo Love Made Fresh fresh refrigerated line reached approximately 5,000 cooler placements within roughly two months of launch and captured approximately 5% category market share.
Macro risk for Q3 centers on two compounding pressures: private-label competition and input cost inflation including tariffs, with General Mills guiding that newly enacted tariffs represent an incremental gross cost of approximately 1%–2% of cost of goods sold layered atop pre-existing input cost inflation of roughly 3% of COGS, with management actively pursuing ingredient substitution and reformulation to offset the headwind, though any wheat cost relief from lower spot prices is not expected to flow through until FY2027 given existing hedge positions.
- Micron Technology (MU): Micron is scheduled to report its fiscal Q2 2026 results, with analyst consensus projecting earnings of $8.42 per share on revenue of $18.70 billion, figures that align precisely with the guidance midpoints CEO Sanjay Mehrotra provided on the Q1 call.
Should estimates prove accurate, the $8.42 EPS would represent a 439.7% year-over-year surge from the same period last year, a testament to how dramatically the AI memory supercycle has transformed Micron’s profitability in a single fiscal year. The $18.70 billion revenue consensus implies a 132.3% year-over-year advance from the $8.05 billion reported, which itself was the quarter in which HBM revenue crossed the $1 billion milestone for the first time, a baseline that Q2 FY2026 is expected to far exceed as HBM scales toward the majority of Micron’s high-margin DRAM mix.
The most consequential leading indicator is Micron’s disclosure on the Q1 call that its entire calendar 2026 HBM supply is already committed under price-and-volume agreements, effectively locking in the revenue trajectory for the fiscal year and compressing margin uncertainty; management guided Q2 gross margin to 68%, a 1,120 basis-point sequential expansion from Q1’s 56.8%, underscoring how rapidly the product mix is shifting toward premium AI memory.
Looking to Q3 FY2026 guidance, investors will focus on whether Micron can sustain gross margins in the upper-60% range as HBM mix rises and whether management maintains its FY2026 revenue target in excess of $50 billion; the company raised its FY2026 capex plan to approximately $20 billion to fund HBM capacity expansion and 1-gamma DRAM node ramp across Boise, Idaho and Hiroshima, Japan facilities.
The principal macro risks to Q2 results and the Q3 guide include China’s ongoing restrictions on Micron’s ability to sell into critical information infrastructure operators, the potential for retaliatory tariffs on U.S. semiconductor exports to amplify pricing volatility for NAND and commodity DRAM, and the possibility that HBM supply additions from Samsung’s accelerating ramp could compress near-term spot pricing before demand fully absorbs incremental capacity.
📅 Thursday, Mar 19th
- Accenture plc (NYSE: ACN): Accenture, the world’s largest IT services and consulting firm by revenue, is scheduled to report its fiscal Q2 2026 earnings with analyst consensus projects EPS of $2.86 on revenue of approximately $17.78 billion, within management’s guided range. Should estimates prove accurate, it would represent a 1.4% year-over-year increase. The $17.78 billion revenue estimate implies approximately 6.5% year-over-year growth, consistent with the 6% U.S.-dollar revenue expansion
A critical leading indicator is total new bookings of $20.9 billion, up 12% in U.S. dollars, with 33 clients each exceeding $100 million in quarterly bookings, underwriting a robust revenue pipeline entering the February quarter. The Q1 service mix favored managed services, with Consulting at $9.4 billion (+3% local currency) versus Managed Services at $9.3 billion (+7% local currency); geographically, Americas grew 4% in local currency (6% excluding federal), EMEA +4% led by the U.K. and Italy, and Asia Pacific +9% led by Japan and Australia.
The AI consulting story is the pivotal growth driver: CEO Julie Sweet reported Q1 FY2026 advanced AI bookings of $2.2 billion, nearly doubling year over year, alongside AI-related revenue of $1.1 billion, up 120% year over year, and noted Q1 will be the final quarter of standalone AI metric disclosure as advanced AI is now embedded across virtually all client engagements.
The principal macro headwind is the Department of Government Efficiency, which has terminated at least 30 Accenture Federal Services contracts representing approximately $240 million in claimed federal savings, a disruption management has quantified as a 1% to 1.5% full-year revenue drag; broader enterprise IT budget caution and tariff-driven client-spend scrutiny compound the near-term uncertainty.
- Nike, Inc. (NYSE: NKE) Nike is scheduled to report its fiscal Q3 2026 results, with analyst consensus projecting earnings of approximately $0.30 per share on revenue of approximately $11.25 billion. If estimates prove accurate, the $0.30 EPS would represent a 44.4% year-over-year decline, reflecting restructuring charges, gross margin compression, and a lighter revenue base as Nike unwinds its direct-to-consumer overextension.
The $11.25 billion revenue consensus implies a roughly 0.2% year-over-year contraction, a material improvement relative to the 9% reported decline logged in that year-ago quarter and consistent with management’s Q3 guidance of a low-single-digit revenue decline. The most instructive recent data point is Q2 FY2026: Nike posted $12.43 billion in revenue, up 1% year over year, with North America surging 9% to $5.63 billion even as Greater China dropped 17% to $1.42 billion, a divergence CEO Elliott Hill attributed to brand recovery momentum domestically offset by macro and competitive headwinds in China.
Nike Direct revenues remained a drag in Q2, falling 8% to $4.6 billion, while the wholesale channel, the centerpiece of Hill’s “Win Now” reengagement strategy, rose 8% to $7.5 billion, signaling that retailer partnerships are regaining traction even as direct-to-consumer traffic rebuilds.
With 160 million active NikePlus members, the membership ecosystem serves as Nike’s long-run demand engine, though full-price conversion remains a critical Q3 metric as the company scales back promotional clearance. Inventories entered Q3 at $7.7 billion, down 3% year over year with units down high-single digits, signaling disciplined stock normalization even as per-unit costs remain elevated from tariff pass-through.
The sharpest macro risk is tariff exposure: Nike sources approximately 37.9% of footwear from Indonesia and 25.7% from Vietnam, both subject to steep U.S. import duties, and management has estimated an annualized tariff burden of approximately $1.5 billion, which it is offsetting through price increases and supply chain diversification, even as competition from On Running and HOKA limits pricing power.
We hope this helps and happy trading!
— Trade and Travel Team
Related Blogs


Follow Us
Testimonials
Hear from students on why they chose the Trade and Travel Family and how it has changed their lives.

