
U.S. stocks dipped last week as investors reacted to mixed economic data and a quiet stretch of company earnings. The S&P 500 (SPY) eased by 0.28%, reflecting modest profit-taking after June’s rally. The tech-heavy Nasdaq (QQQ) slipped 0.36% as growth names paused amid choppy trading. Meanwhile, the Dow Jones Industrial Average (DIA) led the pullback with a 1.01% decline.
Rather than a full-blown earnings season, the week featured an earnings lull, with few meaningful Q2 filings from large-cap companies. Market moves were driven more by positioning ahead of key economic releases and tariff policy updates than by individual corporate results, while subdued summer volumes kept volatility muted.
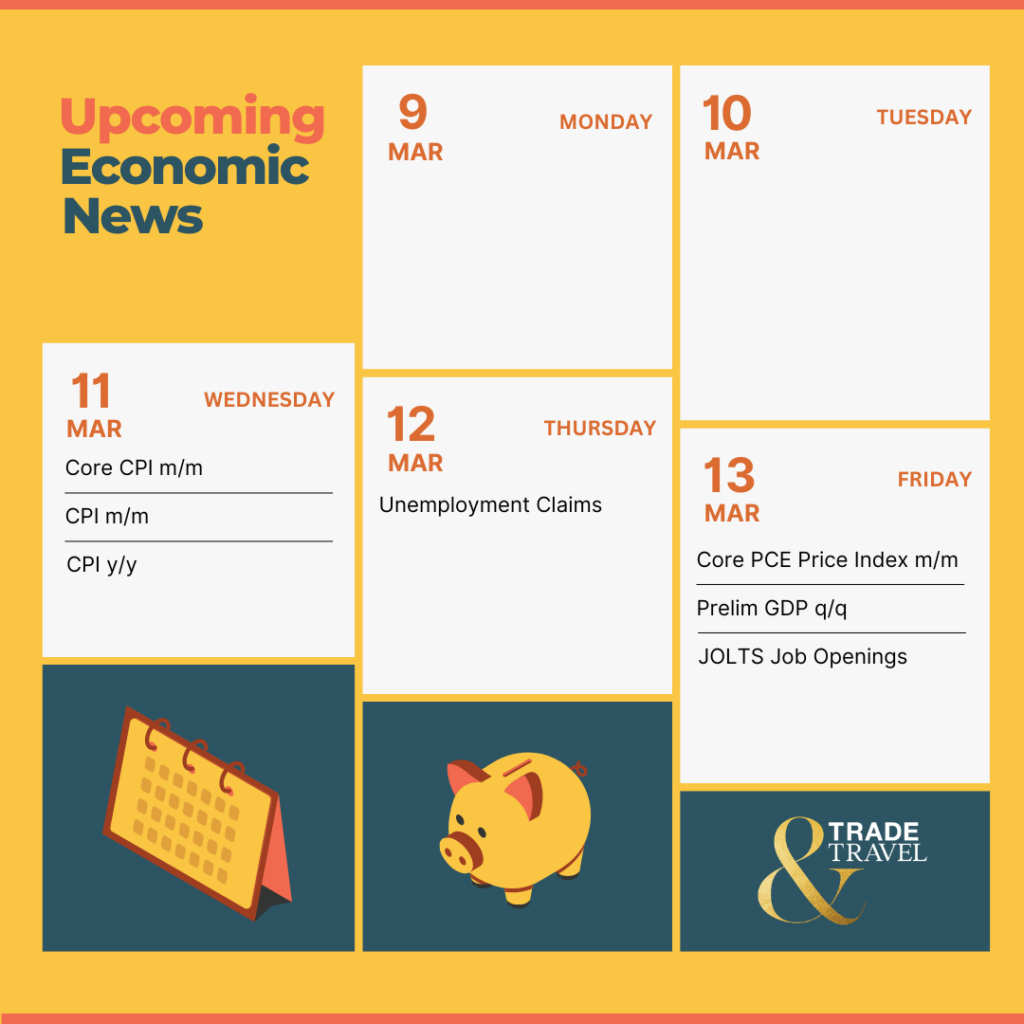
Heading into the week of July 14, attention will turn to the June inflation report, industrial production, and retail sales, along with a fresh slate of Q2 earnings amid evolving macro pressures.
📅 Tuesday, Jul 15th
- Core CPI m/m: The upcoming Core CPI m/m report is forecast to show a 0.3% monthly increase compared to the previous reading of 0.1%, signaling a notable acceleration in underlying inflation pressures that could prompt the Federal Reserve to maintain its cautious stance on interest rate cuts.
Market participants should closely monitor this tripling of the monthly rate as it may indicate that tariff impacts are beginning to materialize in core goods prices, particularly in sectors like automotive and household goods, while also watching for any signs of persistent services inflation in categories such as shelter, medical care, and motor vehicle insurance. The 0.3% forecast represents a significant shift from the subdued 0.1% readings in recent months and could push the annual core CPI rate toward 3.0%, potentially influencing Federal Reserve policy decisions and market expectations for upcoming rate cuts. - CPI m/m & y/y: The US Consumer Price Index (CPI) is forecasted to show a monthly increase of 0.3% compared to the previous month’s 0.1%, with the year-over-year inflation rate expected to accelerate to 2.6% from May’s 2.4%. Economists anticipate that CPI will make the largest monthly gain since January, driven primarily by early tariff pass-through effects on goods prices as companies begin absorbing higher import costs from the Trump administration’s trade policies. Market participants should closely monitor for signs of tariff-driven price increases and services inflation trends, as these readings will be crucial for Federal Reserve policy decisions, with markets currently pricing in a 60% probability of a rate cut in September.
📅 Wednesday, Jul 16th
- Core PPI m/m: The upcoming core Producer Price Index (PPI) month-over-month report is forecasting a 0.2% increase compared to the previous month’s 0.1% reading. This acceleration in core wholesale inflation comes at a critical juncture for monetary policy, as the Federal Reserve monitors producer-level price pressures to gauge future consumer inflation trends.
The increase represents an uptick in underlying inflationary pressures at the producer level. On an annual basis, core PPI has shown a cooling trend, declining from 3.2% in April to 3.0% in May 2025, which came in below the expected 3.1% forecast. Traders should particularly focus on whether this monthly acceleration signals a reversal of the disinflationary trend or merely reflects temporary supply chain adjustments, as the core measure excludes volatile food and energy components that have been driving overall PPI volatility. - PPI m/m: The upcoming Producer Price Index (PPI) month-over-month report is forecasted to show a 0.3% increase, representing a notable acceleration from the previous month’s 0.1% reading. This anticipated jump suggests that wholesale inflation pressures are building at the producer level, which could signal future consumer price increases as businesses typically pass higher production costs to consumers.
Market participants should closely monitor this report as it serves as a leading indicator of broader inflationary trends and could influence Federal Reserve monetary policy decisions. A reading at or above the 0.3% forecast would likely strengthen the case for maintaining current interest rates or potentially prompt hawkish Fed commentary, while a softer-than-expected print could support market expectations for future rate cuts. The significance of this release is heightened given that PPI data often provides early insights into inflation before it reaches consumers, making it a critical tool for anticipating market-moving shifts in the economic landscape.
📅 Thursday, Jul 17th
- Core Retail Sales m/m: The upcoming U.S. Core Retail Sales report is expected to show a 0.3% month-over-month increase following May’s -0.3% decline, marking a potential rebound in underlying consumer spending. Traders should watch whether the actual reading meets or exceeds the 0.3% forecast, as stronger-than-expected spending could reinforce expectations of sustained Fed tightening. Investors should also monitor the headline Retail Sales figure and any downward revisions to prior months, since divergence between core and headline figures or revisions could signal shifts in consumer behavior and market sentiment.
- Retail Sales m/m: The U.S. retail sales report for June is expected to show a modest rebound of 0.2% month-on-month, following May’s sharp 0.9% decline. This will signal whether consumers are regaining momentum after last month’s pullback. Investors should pay close attention to the ex-autos category and the control group measure, which excludes autos, gasoline, building materials, and food services, and is often seen as the best indicator of underlying spending trends. Traders will also watch the market reaction in Treasury yields and the U.S. dollar. A stronger-than-expected reading could push yields higher and strengthen the dollar, while a weaker result may boost risk appetite in equities.
- Unemployment Claims: The U.S. Department of Labor’s upcoming weekly initial jobless claims report is forecast at 234,000 following last week’s 227,000 initial filings. Market participants will focus on the deviation of actual claims from the 234,000 estimate, as a materially higher print could signal labor market weakening and increase volatility in equities, while a lower reading would reinforce the case for a resilient economy and could boost risk assets. Additionally, market participants will watch the four-week moving average and seasonal adjustment notes for signs of underlying trends beyond weekly noise.
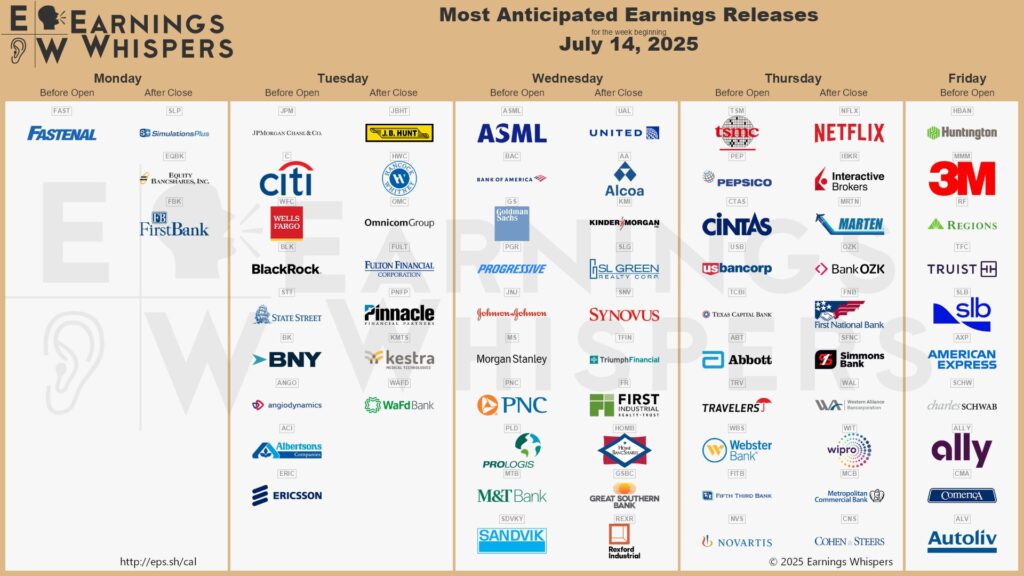
💼 As we wait for earnings season to ramp up, here are some early movers reporting this week:
📅 Tuesday, Jul 15th
- BlackRock, Inc. (BLK): BlackRock will report Q2 2025 results before markets open with analysts forecasting $10.77 EPS, up 4% year-over-year, and $5.46 billion in revenue, a 13.7% increase from the same period last year. Market participants should focus on assets under management (AUM), particularly long-term AUM, expected to reach $10.76 trillion, and net inflows of $124.01 billion, including $57.88 billion in ETF inflows, to gauge client demand and market share trends. Key business drivers include technology services revenue, projected at $493.7 million (+25% YoY), and continued expansion in private markets as the firm targets $400 billion in private fundraising by 2030.
📅 Wednesday, Jul 16th
- United Airlines Holdings, Inc. (UAL): United Airlines will report Q2 2025 results with analysts forecasting revenue of approximately $15.36 billion, up about 2.4% year-over-year, and consensus EPS of $3.81, which would represent a 7.9% decline from the same period last year. Market participants should watch UAL’s guided EPS range of $3.25–4.25 to gauge management’s confidence amid softer domestic demand, as well as year-over-year trends in total revenue per available seat mile (TRASM) and unit costs excluding fuel (CASM ex-fuel) to assess margin resilience and cost discipline.
Pay close attention to premium-cabin and loyalty revenue growth. In Q1, United reported that international premium-cabin RASM increased by more than 5% year over year, while loyalty revenue rose 9.4%. These high-margin segments remain key drivers of profitability, especially in an uncertain macro environment.
📅 Thursday, Jul 17th
- Taiwan Semiconductor Manufacturing Co. (TSM): Taiwan Semiconductor Manufacturing Co. is set to report its second-quarter results, with analysts forecasting revenue of US$29.9 billion, representing a 45.1% year-over-year increase, and earnings per share of approximately US$2.37. Market participants should focus on gross margin trends, with consensus expecting a range of 57% to 59% compared to 58.8% in Q1, and operating margins between 47% and 49% following Q1’s 48.5%. Guidance for the third quarter, including revenue outlook, capital expenditure updates, and capacity ramp-up in 3 nm (refers to 3-nanometer semiconductor process nodes) and Arizona fabs amid surging AI chip demand, will also be critical for gauging TSMC’s ability to sustain its growth trajectory.
- Netflix, Inc. (NFLX): Netflix is set to report Q2 2025 results, with consensus estimates calling for revenue of approximately $11.048 billion, up 15.6% year-over-year, and EPS of about $7.07 versus $6.61 in Q1 2025. Market participants will focus on Netflix’s international growth and its 94 million-member ad-supported tier, along with ARPU trends following recent price increases. Traders should monitor operating margin expansion, with guidance targeting approximately 33.3% compared to 31.7% in Q1, and listen for Q3 revenue guidance near $11.265 billion to assess whether this momentum can continue.
📅 Friday, Jul 18th
- Charles Schwab Corporation (SCHW): Charles Schwab is set to report Q2 2025 results, with analysts projecting EPS of $1.10 per share on revenue of $5.71 billion. Year-over-year, EPS is expected to jump roughly 50% and revenue to rise about 21.7% compared with Q2 2024, reflecting strong trading activity and net interest income growth. Market participants should focus on net interest revenue trends, any updates to client assets (which reached $9.9 trillion in Q1, up 9% year-over-year), and management’s commentary on trading volumes and margin outlook for clues on forward momentum.
We hope this helps and happy trading!
– Trade and Travel Team
Related Blogs


Follow Us
Testimonials
Hear from students on why they chose the Trade and Travel Family and how it has changed their lives.

