
The S&P 500 snapped a five-week losing streak, with SPY gaining approximately 3.4% to close on the last full trading session before the Good Friday holiday. QQQ rose roughly 4.0%, and DIA advanced about 3.0%, though all three benchmarks remain negative year-to-date. The week’s defining move came on Tuesday, on a Wall Street Journal report that the Trump administration may wind down the Iran conflict without requiring the Strait of Hormuz to be fully reopened, a concession that could gradually ease crude prices.
WTI crude pulled back to approximately $111.54 per barrel from peaks above $120 earlier in the month, though prices remain elevated well above the $65-$70 range that prevailed before the U.S.-Iran military engagement began. Gold extended its rally to roughly $4,676 per ounce, a fresh record, as investors continued to price in persistent inflation and central bank demand. The 10-year Treasury yield edged higher to 4.48%, holding near the upper end of its recent range as the market digested a weekly jobless claims print of 210,000 and ISM Manufacturing at 52.7%, both released on Thursday.
The marquee data event landed on Good Friday: March nonfarm payrolls surprised to the upside at +178,000 versus a +60,000 consensus, and the unemployment rate ticked down to 4.3% from 4.4%. February payrolls, however, were revised sharply lower to -133,000 from the previously reported -92,000, a reminder that the labor market’s recent trajectory is weaker than headline prints suggest. ISM Services PMI, also released Friday with markets closed, will be the first data point to digest when trading resumes Monday.
The week ahead carries an unusually dense macro calendar with earnings reports, headlined by Delta Air Lines and Constellation Brands on Wednesday, that round out a full slate for investors navigating the intersection of geopolitical risk, resurgent inflation, and a deeply split Federal Reserve.
How This Impacts You
You’re heading into a week where Monday’s open could move fast, so if you’re holding positions, tighten your review process and decide in advance what you will do if the market gaps up or down. With inflation still sticky and oil elevated, pay closer attention to companies in your watchlist that are sensitive to input costs and note how they react to earnings this week, rather than assuming broad market direction will hold.
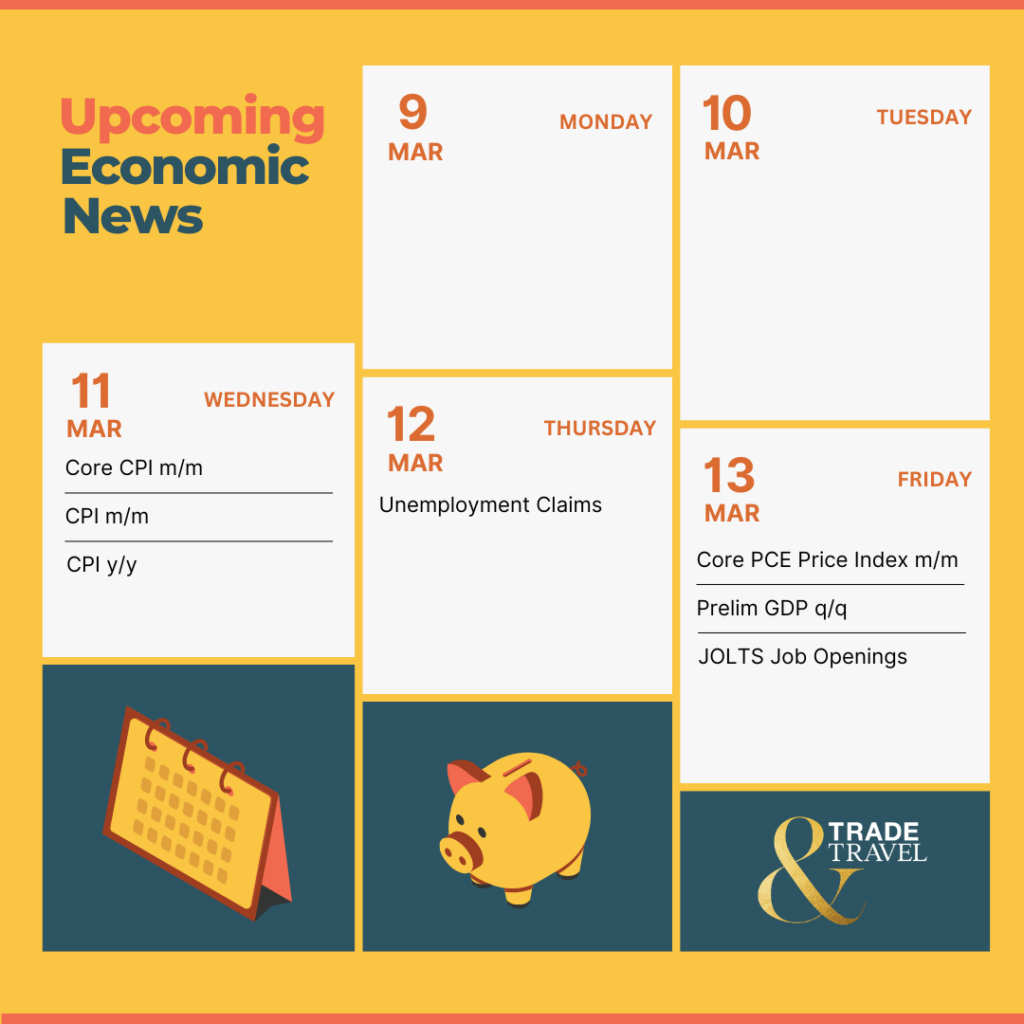
📅 Monday, April 6th
- ISM Services PMI: March 2026
The Institute for Supply Management releases the March 2026 Services PMI, a composite diffusion index surveying purchasing and supply executives across 18 U.S. service industries in which readings above 50.0 indicate sector expansion and below 50.0 signal contraction; the release was rescheduled from Friday, April 3, because equity markets were closed for Good Friday.
The prior month’s composite registered 56.1%, the highest reading since July 2022 and a 2.3-percentage-point jump from the month before, extending the expansion streak to 20 consecutive months; all ten reported sub-indexes were simultaneously in expansion territory for the first time since March 2021. Business Activity surged to 59.9% (+2.5 points), New Orders rebounded to 58.6% (+5.5 points), and New Export Orders recovered to 57.2% (+12.2 points) from a January trough that had been the lowest since March 2023; Prices Paid fell to 63.0% from 66.6% (-3.6 points), the first deceleration in services input costs in five months, while Employment improved modestly to 51.8% (+1.5 points).
Consensus projects a March composite of 54.8, implying a 1.3-point pullback from the prior month’s multi-year high; markets will watch whether the ISM survey, which captures a broader and more domestically weighted panel than S&P Global’s flash reading, confirms the abrupt services-sector downshift or sustains expansion above 55.0, with the Prices Paid sub-index carrying outsized weight given that ISM Manufacturing’s March Prices Paid spiked to 78.3%, the highest since June 2022, raising the question of whether petroleum-driven cost pressures have begun spilling into services inflation.
📅 Wednesday, April 8th
- FOMC Meeting Minutes: March 17-18 Meeting
The Federal Reserve releases the minutes of the March 17-18, 2026 Federal Open Market Committee meeting; the document provides a detailed account of the policy debate, the range of views among participants, and the economic reasoning behind the rate decision, offering markets a granular look beyond the post-meeting statement and press conference.
The Committee voted 11-1 to hold the federal funds rate at 3.50%-3.75%, with Governor Stephen Miran casting the lone dissent in favor of a 25-basis-point cut; notably, Governor Christopher Waller, who had joined Miran in dissenting at the January meeting, aligned with the majority this time, a shift investors will scrutinize in the minutes for any signal of a narrowing appetite for near-term easing.
The updated Summary of Economic Projections maintained a median end-2026 rate of 3.4%, consistent with one 25-basis-point cut, but the dot plot revealed a deeply split Committee: seven members favored no cuts in 2026 while seven projected one, and five penciled in two or more; the SEP raised the 2026 PCE inflation forecast to 2.7% from 2.4% in December while leaving the unemployment projection at 4.4%, and 17 of 19 participants flagged upside risks to inflation.
Chair Powell acknowledged at the press conference that the Fed expects “some progress on inflation, not as much as we had hoped”, attributing between half and three-quarters of core inflation (running near 3%) to tariffs and warning of an “energy shock of some size and duration” tied to Middle East developments whose economic implications remain “uncertain”. Markets will parse the minutes for any discussion of scenarios that could accelerate or delay the projected single cut.
📅 Thursday, April 9th
- Core PCE Price Index m/m: February 2026
The Bureau of Economic Analysis releases the Personal Income and Outlays report; the Core PCE Price Index, which excludes food and energy, is the Federal Reserve’s preferred inflation gauge, measuring consumer price changes on a chain-weighted basis that adjusts for substitution behavior. January 2026 Core PCE rose +0.4% month over month and +3.1% year over year, the highest annual rate in nearly two years; headline PCE posted +0.3% month over month and +2.8% year over year, and back-to-back +0.4% core readings represent the stickiest two-month sequence since early 2024.
The January component breakdown revealed persistent divergence: core services prices ran at +3.5% year over year, accelerating from the +3.4% pace that held from September through December; core goods increased +1.3%, a deceleration from +1.7% the prior month; and shelter rose only +0.2% month over month, suggesting housing disinflation is progressing even as the “supercore” measure posted +0.4%.
The Fed held rates at 3.50%-3.75% at its March meeting, with officials raising their year-end core PCE forecast to 2.7%, up 30 basis points from December, acknowledging that tariff pass-through and persistent services inflation have complicated the path to 2%. Consensus projects the February reading at +0.4%, unchanged from the prior two months; a third consecutive +0.4% print would solidify the reacceleration narrative and push rate-cut expectations further out, while a print at or below +0.3% would reopen the debate about seasonal anomalies and revive the case for earlier easing.
- Final GDP: Q4 2025
The U.S. Bureau of Economic Analysis releases the Q4 2025 GDP Third Estimate, alongside the first look at GDP by Industry and Corporate Profits for the full quarter and year; GDP measures the annualized quarter-over-quarter change in inflation-adjusted output, with positive readings indicating expansion. The second estimate pegged Q4 growth at +0.7%, a sharp downward revision from the advance estimate of +1.4% and a dramatic deceleration from the prior quarter’s +4.4%; full-year 2025 GDP was revised to +2.1%.
The component breakdown revealed broad softening: consumer spending grew at +2.0%, down from the advance’s +2.4%; business investment slowed to +2.2% from +3.7%; exports fell at a -3.3% rate, the steepest decline since mid-2023; and federal government spending plunged -16.6%, subtracting roughly 1.0 percentage point from headline growth due to the 43-day shutdown.
Absent that shutdown drag, underlying private-sector growth would have printed near 1.7%; the corporate profits release will reveal whether the slowdown compressed margins or whether firms passed costs through to consumers, a question with direct implications for the tariff-inflation narrative. Consensus projects the third estimate at +0.7%, unchanged from the second reading; a downward revision below +0.5% would amplify recession concerns, while an upward revision toward +1.0% would suggest the slowdown was less severe than feared.
📅 Friday, April 10th
- Consumer Price Index (Core CPI m/m, CPI m/m, CPI y/y): March 2026
The Bureau of Labor Statistics releases the March 2026 Consumer Price Index, a monthly report in which headline CPI-U tracks all items while the core measure excludes food and energy to isolate underlying inflation; this print captures the first full month of the Middle East energy shock, with WTI crude surging above $100 per barrel during March, making it the most consequential inflation reading since 2022.
February established a deceptively calm baseline: headline CPI rose +0.3% month over month and held at +2.4% year over year, while core CPI posted +0.2% month over month and +2.5% year over year; shelter advanced just +0.2%, and energy contributed a modest +0.6% before the crude-oil spike reshaped the March landscape.
Early tariff signals emerged beneath the benign February headline: apparel surged +1.3%, the largest monthly jump since September 2018; food rose +0.4%, and core goods edged up +0.1%, while used cars fell -0.4% for a third consecutive decline, a disinflationary offset unlikely to persist as tariffs raise imported auto-parts costs.
Chair Powell warned on March 31 of “another supply shock” layered on tariff-driven inflation; he has estimated that tariffs account for “between a half and three-quarters” of the gap between core inflation near 3% and the Fed’s 2% target.
Consensus projects headline CPI at +1.0% month over month, core CPI at +0.3%, and CPI year over year at +3.4%. A +1.0% headline print would be the largest single-month increase since mid-2022, cementing expectations that the Fed will hold rates at 3.50%-3.75% well into the second half, while a headline below +0.7% would suggest energy passthrough is slower than feared and revive pricing for a summer cut.
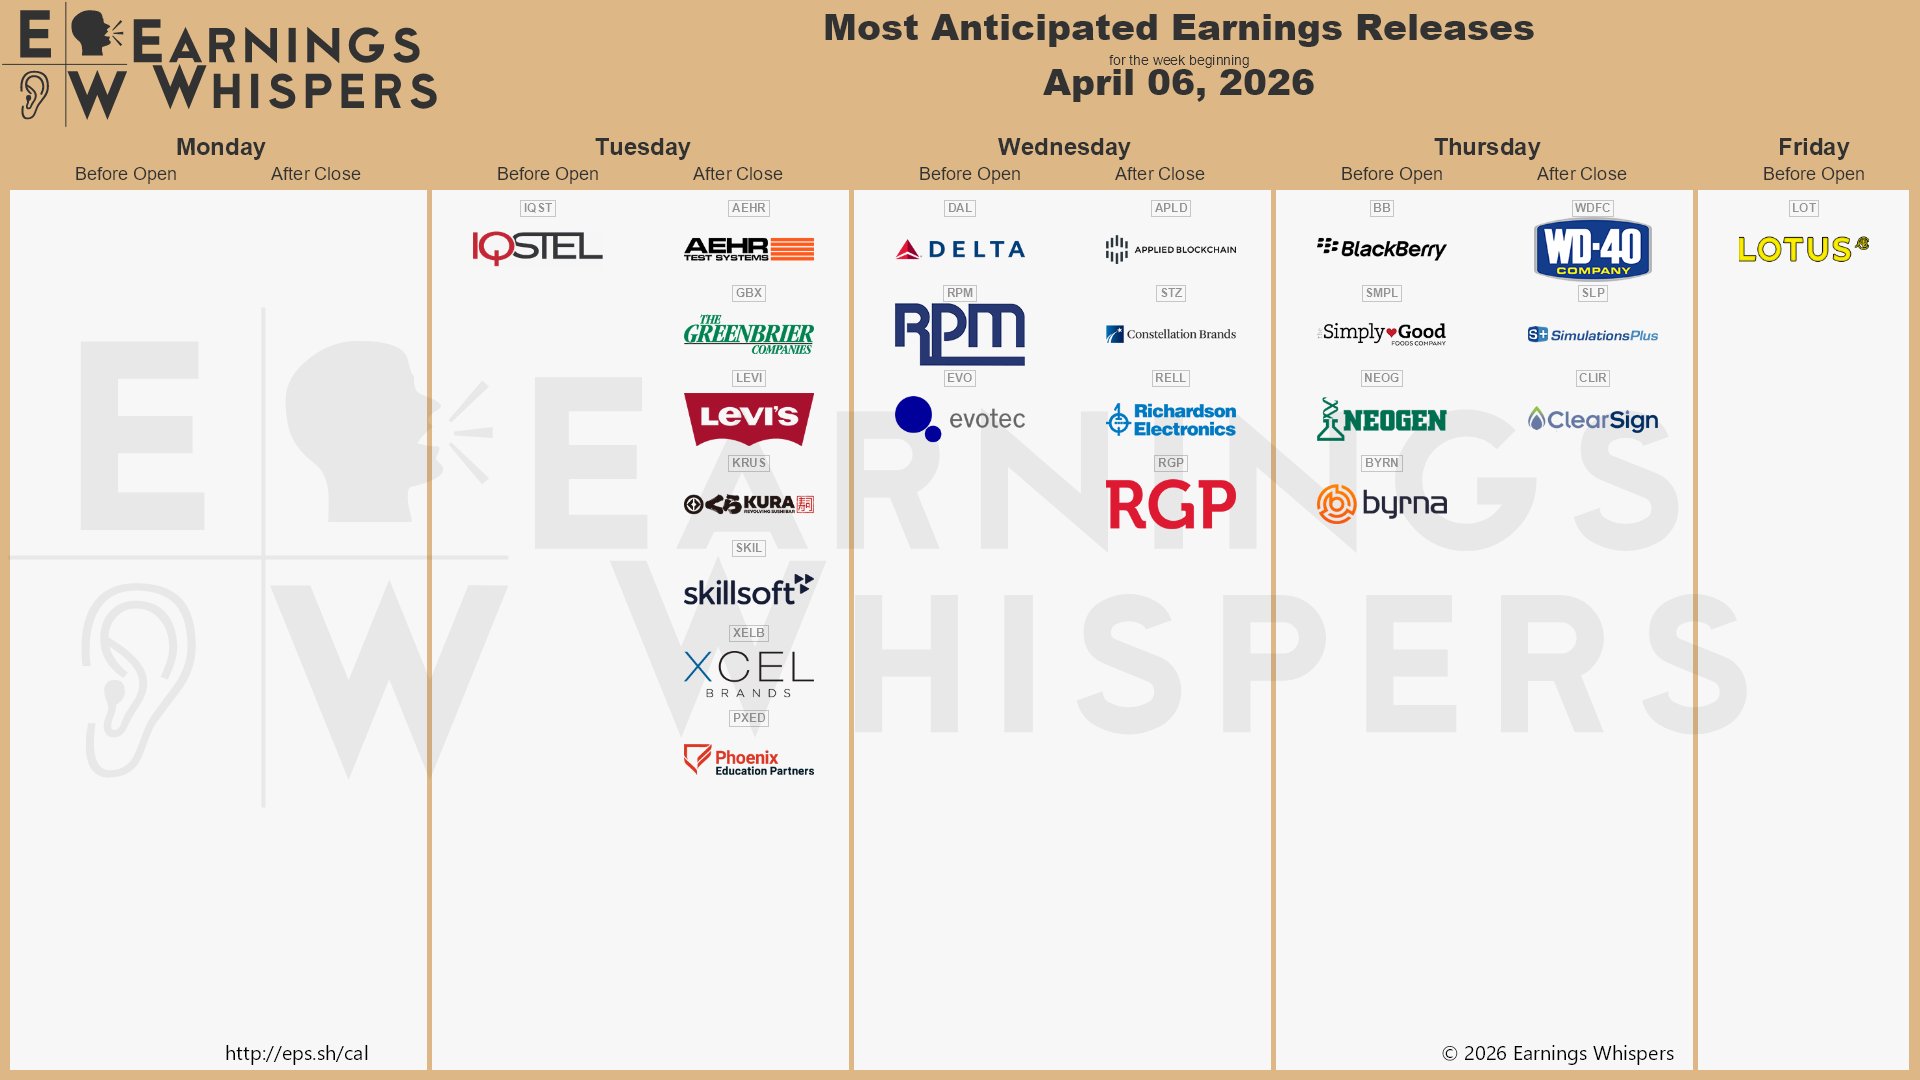
💼 This week’s earnings slate spans airlines, spirits, AI infrastructure, and consumer brands, with Delta Air Lines leading on Wednesday and Constellation Brands, Applied Digital, and WD-40 rounding out a cross-sector lineup that will test whether Q1 demand held up against tariff headwinds and $100 oil.
📅 Tuesday, April 7th
- Levi Strauss (LEVI): Q1 FY2026 (After Close)
Levi Strauss & Co. reports its fiscal Q1 FY2026 results. Analyst consensus projects EPS of $0.37 on revenue of $1.65 billion. If estimates prove accurate, the $0.37 EPS would represent a 2.6% decline from the $0.38 delivered a year ago, a modest dip that reflects seasonal patterns rather than structural erosion, given that the company delivered EPS of $0.49 last quarter on stronger holiday demand.
The $1.65 billion revenue estimate implies a 7.8% year-over-year advance from the $1.53 billion posted in the year-ago period, a deceleration from the 12% revenue growth delivered last quarter when net revenues reached $1.84 billion. A leading indicator supporting the growth thesis: direct-to-consumer revenue climbed to $1.05 billion last quarter, up 12% year over year, with e-commerce sales advancing 22% on an organic basis, a trajectory that, if sustained, positions the DTC channel to exceed half of total revenue within the next two quarters.
DTC now represents approximately 49% of total net revenues, up from 42% two years ago, as the company accelerates its shift away from lower-margin wholesale distribution toward owned channels; the digital storefront continues to outpace physical retail, underscoring management’s omnichannel investment thesis.
Beyond Yoga, the premium athleisure brand acquired in 2021, posted full-year revenue of $151.3 million last fiscal year, up 15.4% year over year, with a 37% surge last quarter; women’s products now account for 36% of the Levi’s brand total, up from 29% in 2018, a diversification that broadens the company’s addressable market.
Gross margin expansion remains a structural tailwind: last quarter’s 63.7% gross margin represented a 350-basis-point improvement from a year earlier, and the February 27, 2026 divestiture of the Dockers brand to ABG for $311 million removes a lower-margin drag from Q1 onward. The primary macro risk centers on tariff exposure: Vietnam, the company’s largest sourcing hub, carries a 20% tariff rate under the July 2025 U.S.-Vietnam trade agreement, translating to an estimated $25 million to $30 million in annual incremental cost, a headwind compounded by broader consumer spending pressure as inflation persists above the Fed’s target.
📅 Wednesday, April 8th
- Delta Air Lines (DAL): Q1 FY2026 (Before Open)
Delta Air Lines reports its fiscal Q1 FY2026 results, with analyst consensus projecting EPS of $0.64 on revenue of $14.82 billion. If estimates prove accurate, that EPS figure would represent a 39.1% increase from the $0.46 delivered a year ago, extending a streak of five consecutive quarterly earnings beats. The revenue estimate implies a 5.6% year-over-year advance from the $14.04 billion reported in the year-ago quarter.
Management raised its Q1 revenue outlook to a range of $15 billion to $15.3 billion in March, citing record booking activity. CEO Ed Bastian noted that Delta recorded eight of its top ten sales days in history during the quarter, with total bookings running 25% above the prior-year period. Premium and loyalty revenues comprised nearly 60% of total adjusted operating revenue a year ago, and management has signaled that all new seat growth this year will be concentrated in premium cabins, a strategy designed to sustain the margin advantage that premium products deliver.
SkyMiles, valued at $31 billion as the world’s most valuable airline loyalty program, spans more than 120 million members, providing durable spending visibility across cycles. The program underpins a partnership with American Express that generated $8 billion in revenue last year. Delta plans to extend its three-tier fare structure (Basic, Classic, Extra) into business and first class cabins this year, a move that could unlock incremental ancillary revenue by letting passengers customize product bundles across premium seats.
The carrier posted a load factor of 81.4% in the year-ago quarter, and capacity growth for the full year is guided at 3%. Corporate travel survey results indicate roughly 90% of companies expect travel volumes to increase or hold steady this year. Jet fuel costs present the dominant risk heading into the call, as management’s initial $400 million headwind estimate was based on oil near $95 per barrel, a figure now well below the current $111 level, suggesting the actual impact could be meaningfully larger; however, Delta’s ownership of the Monroe Energy refinery in Pennsylvania provides a natural hedge on refining margins that its peers lack.
- Constellation Brands (STZ): Q4 FY2026 (After Close)
Constellation Brands, Inc. reports its fiscal Q4 FY2026 results, with analyst consensus projecting EPS of $1.73 on revenue of $1.89 billion. If estimates prove accurate, the $1.73 EPS figure would represent a 34.2% decline from the $2.63 delivered in the same quarter last year, extending a trajectory of year-over-year erosion driven by wine and spirits divestitures and softening beer volumes. The $1.89 billion revenue estimate implies a roughly 12.5% year-over-year contraction from $2.16 billion a year ago.
That would mark a sharper pullback than the 10% reported decline posted last quarter, when net sales totaled $2.22 billion. For directional context, beer depletions in the prior quarter showed divergent brand momentum: Modelo Especial, the top-selling beer by dollar sales in U.S. tracked channels, declined approximately 4%, while Pacifico surged roughly 15%, suggesting portfolio mix rather than category weakness is shaping top-line pressure. The beer segment, which generates approximately 85% of consolidated sales, posted an operating margin of 38% last quarter, a resilience investors will want to see sustained as aluminum tariff headwinds persist.
On the portfolio reshaping front, the SVEDKA vodka brand was divested to Sazerac, and mainstream wine brands have been largely exited, leaving wine and spirits revenue down roughly 65% from the prior-year quarter as the company concentrates on premium and craft tiers. Management reaffirmed full-year comparable EPS guidance of $11.30 to $11.60, a range that implies Q4 must deliver at the stronger end to land within the corridor. The company projects beer net sales to decline 4% to 2% for the full fiscal year, underscoring the volume pressure weighing on the core business.
The dominant risk heading into the call is the 25% tariff now applied to Mexican imports, which exposes the vast majority of Constellation’s beer supply chain. Analysts estimate a potential $3.00 to $3.75 annual EPS impact if tariffs persist for the full year, though management has signaled pricing adjustments and cost offsets can absorb a meaningful portion.
- Applied Digital (APLD): Q3 FY2026 (After Close)
Applied Digital Corporation reports fiscal Q3 FY2026 results, with analyst consensus projecting EPS of -$0.13 on revenue of approximately $78.5 million. If estimates prove accurate, the -$0.13 EPS would represent a narrowing of losses from the -$0.16 per share posted in the year-ago quarter, a 18.8% improvement that reflects the transition from early-stage capital deployment to contracted lease revenue recognition.
The $78.5 million revenue consensus implies approximately 48.4% year-over-year growth from the $52.9 million reported a year earlier, though the sequential comparison is more revealing: last quarter’s $126.6 million included a nonrecurring $73 million CoreWeave turnkey fit-out payment that will not repeat, making steady-state lease revenue the primary growth driver in Q3.
The most closely watched metric will be how much of the 600 MW in total contracted capacity, representing approximately $16 billion in prospective lease revenue, converts to recognized hosting income as Polaris Forge 1 ramps beyond the initial 100 MW that achieved Ready-for-Service status last quarter. CoreWeave holds 400 MW under contract at Polaris Forge 1 alone, generating $12 million in partial-quarter lease revenue last quarter, and the cadence of additional megawatt energizations will determine whether Q3 revenue exceeds or falls short of consensus.
Applied Digital’s balance sheet has undergone a dramatic transformation: the company now carries approximately $5 billion in total debt following a $2.15 billion senior secured notes offering in March 2026 at 6.750% to fund 200 MW of critical IT load at Polaris Forge 2, layered atop the $2.35 billion of 9.25% notes issued in November 2025.
Nvidia’s complete exit from its $177 million APLD stake in February 2026 triggered a 14% single-day decline and raised questions about whether the hyperscaler ecosystem views Applied Digital’s debt-fueled buildout as sustainable. The planned divestiture of the Cloud Services segment via the proposed ChronoScale merger with EKSO Bionics, expected to close in the first half of 2026, would simplify the business into a pure-play data center infrastructure company and potentially accelerate REIT conversion.
📅 Thursday, April 9th
- WD-40 Company (WDFC): Q2 FY2026 (After Close)
WD-40 Company reports fiscal Q2 FY2026 results, with analyst consensus projecting EPS of approximately $1.40 on revenue of approximately $160.6 million. If estimates prove accurate, the $1.40 EPS would represent a 6.1% year-over-year increase from the $1.32 delivered in the year-ago quarter, a rebound from last quarter’s miss when EPS of $1.28 fell short of the $1.45 consensus. The $160.6 million revenue consensus implies approximately 9.9% year-over-year growth from the $146.1 million reported a year earlier, an acceleration from the 1% top-line growth posted last quarter when consolidated net sales reached $154.4 million.
The most encouraging pre-quarter signal was the WD-40 Specialist product line, which delivered 18% sales growth last quarter, driven by a 22% surge in e-commerce channel sales that reflects the company’s “55/30” strategic framework targeting 55% of revenue from maintenance products sold through digital and direct channels. Gross margin will be closely scrutinized after expanding to 56.2% last quarter from 54.8% a year earlier, a 140-basis-point improvement that demonstrated the benefit of premiumization and cost management; sustaining margin above 55% would reinforce the company’s transition from commodity chemical supplier to branded maintenance solutions provider.
Regional performance diverged sharply last quarter: The Americas segment posted $71.9 million in sales, up 4%, and EMEA grew 5% with WD-40 Specialist sales surging 27% in the region, while Asia Pacific declined 10% due to distributor ordering timing.
India contributed a $1.4 million year-over-year increase last quarter, an early indicator of the company’s long-term emerging market thesis, though the Asia Pacific recovery trajectory will be a key topic on the April 9 call. Tariff exposure is the dominant macro risk: CEO Steve Brass acknowledged that tariffs could affect operations in the Americas, particularly Mexico and Canada, but emphasized that WD-40’s decentralized supply chain, which sources raw materials and manufactures products close to end users, substantially mitigates cross-border cost pressures.
Management reaffirmed FY2026 guidance of $630 million to $655 million in revenue and EPS of $5.75 to $6.15, anticipating performance toward the mid-to-high end of those ranges based on strong second-half activity, a guide that brackets the $6.04 consensus and implies meaningful back-half acceleration from Q1’s pace.
We hope this helps and happy trading! 💼
The Trade and Travel Team
Related Blogs


Follow Us
Testimonials
Hear from students on why they chose the Trade and Travel Family and how it has changed their lives.

