
Last week proved to be a soft landing of sorts for U.S. equities, with investors still digesting the Federal Reserve’s rate cut, a 25-basis-point move that had boosted hopes of further easing into year-end. That optimism carried over into early trading, but momentum quickly gave way to profit-taking. Despite Friday’s bounce, all three major indexes finished in the red over the full week. The SPY (S&P 500) shed about 0.28%, the QQQ (Nasdaq) declined by roughly 0.45%, and the DIA (Dow Jones Industrial Average) dipped nearly 0.14%.
Much of the narrative hinged on the push and pull between richly valued equities and a still uncertain macro backdrop. Mega-cap technology names continued to do the heavy lifting, while breadth in the broader market remained narrow. The August PCE (Personal Consumption Expenditures) inflation reading landed largely in line with expectations, with headline PCE rising 2.7% year-over-year and core PCE holding at 2.9%. Those levels underscored the Fed’s delicate balancing act. Policy has clearly shifted toward accommodation after the September rate cut, yet inflation remains well above the Fed’s 2% target, not cool enough to declare victory.
Looking ahead to the start of the fourth quarter, a heavy slate of labor market and business activity data will take center stage. On Wednesday, investors will parse the ADP employment report alongside the ISM Manufacturing PMI, both of which should provide an early read on hiring trends and industrial momentum. Weekly jobless claims arrive Thursday, offering a real-time glimpse into layoffs.
But the highlight will come on Friday with the September Non-Farm Payrolls report, the unemployment rate, and average hourly earnings, all closely watched for signs of whether the labor market is cooling or proving more resilient. The ISM Services PMI is also due that morning, rounding out the picture on U.S. economic activity. A softer jobs number with a slight uptick in unemployment would strengthen expectations for additional rate cuts, while a stronger set of figures could temper the dovish outlook.
📅 Tuesday, Sep 30th
- JOLTS Job Openings: The upcoming JOLTS Job Openings report is expected to show job openings declining to 7.15 million from the previous month’s 7.18 million, marking what could be an 11-month low and reinforcing the ongoing cooling trend in the U.S. labor market.
Market participants should closely monitor whether the actual figure meets, exceeds, or falls short of the 7.15 million forecast, as any significant deviation could influence Federal Reserve policy expectations. Key areas to watch include sector-specific changes, particularly healthcare and social assistance (-181,000) and arts, entertainment, and recreation (-62,000), which have driven recent declines, along with the job openings-to-unemployed worker ratio (currently at a critical 1:1 threshold) and any commentary from Fed officials following the release.
📅 Wednesday, Oct 1st
- ADP Non-Farm Employment Change: The upcoming ADP Non-Farm Employment Change report is expected to show a modest increase of 53,000 jobs compared to the previous month’s reading of 54,000. This slight decline would represent continued weakness in private sector hiring, with the August figure falling well short of the initial forecast of 75,000 jobs and marking a significant slowdown from July’s upwardly revised 106,000 jobs.
Market participants should focus on sector-specific performance, particularly watching for continued strength in leisure and hospitality (which added 50,000 jobs in August) versus ongoing weakness in trade, transportation, and utilities (which shed 17,000 positions), as these divergences signal broader economic shifts.
- ISM Manufacturing PMI: The upcoming ISM Manufacturing PMI report will reveal whether U.S. manufacturing can break its six-month contraction streak as the index is forecast to improve to 49.1 from August’s 48.7, though still remaining below the critical 50 expansion threshold.
Market participants should closely monitor the New Orders component, which rebounded to 51.4 in August from 47.1 in July, as sustained growth in new orders above 50 could signal the end of the manufacturing downturn and provide the foundation for overall PMI expansion above 50 in the coming months. Additionally, watch for the Employment Index (previously 43.8) and Production Index (previously 47.8) to see if they can move closer to 50, while the Prices Paid component at 63.7 remains elevated and could influence Federal Reserve policy decisions if it continues rising significantly above analyst expectations.
📅 Thursday, Oct 2nd
- Unemployment Claims: The upcoming Initial Jobless Claims report, will be closely watched by market participants as it comes against a backdrop of mixed labor market signals, with the previous reading of 218,000 claims significantly beating expectations of 235,000 and the current forecast of 229,000 suggesting a modest uptick.
Market participants should focus on whether claims remain below the 230,000-235,000 threshold, as readings above this level could signal accelerating labor market deterioration and potentially support the Federal Reserve’s dovish stance, while continued low readings might challenge expectations for additional rate cuts given the economy’s resilience. The four-week moving average, currently at 237,500, and continuing claims data will provide crucial context for assessing whether any weekly volatility represents temporary noise or a genuine shift in employment trends, particularly important given recent concerns about labor market softening.
📅 Friday, Oct 3rd
- Average Hourly Earnings m/m: The U.S. Average Hourly Earnings for August is scheduled for release with a consensus forecast of 0.3%, matching the previous reading of 0.3%. Any upside surprise above 0.3% could point to persistent wage inflation and reduce the likelihood of a more dovish Federal Reserve stance. Market participants will also pay close attention to the accompanying labor force data, particularly the unemployment rate, to determine whether stronger wage growth reflects genuinely tight labor market conditions or is merely statistical noise.
- Non-Farm Employment Change: The U.S. Non-Farm Employment Change is expected to show a gain of 51,000 jobs in September, up from the 22,000 increase recorded in August. Market participants should closely watch the average hourly earnings and labor force participation rate, as signs of wage pressures or weak labor supply could sway expectations for rate cuts. Any upside surprise, especially if paired with stronger wage growth, could temper bets on aggressive Federal Reserve easing.
- Unemployment Rate: The U.S. unemployment rate is expected to remain at 4.3%, matching the prior reading. Market participants will scrutinize Non-Farm Payrolls changes by industry, particularly in services and manufacturing. They should also monitor the labor force participation rate, which is hovering near 62.3%, along with average hourly earnings, where sustained 0.3% month-over-month growth would signal sticky wage pressure. Persistent strength in labor data could slow further easing. A surprise rise above 4.3% would strengthen the case for additional rate cuts.
- ISM Services PMI: The upcoming ISM Services PMI report is forecast at 52.0, unchanged from the prior reading of 52.0. A print above 50.0 signals sector expansion, while a dip below would point to contraction in the largest part of the U.S. economy. Market participants will pay close attention to the new orders and business activity subindexes, which drive momentum in services demand. The employment component will also be closely watched, as it provides insight into hiring trends that feed into the broader labor market picture. Any signs of cooling in services activity could reinforce expectations for further Fed easing, while a stronger-than-expected print would suggest resilience and temper those bets.
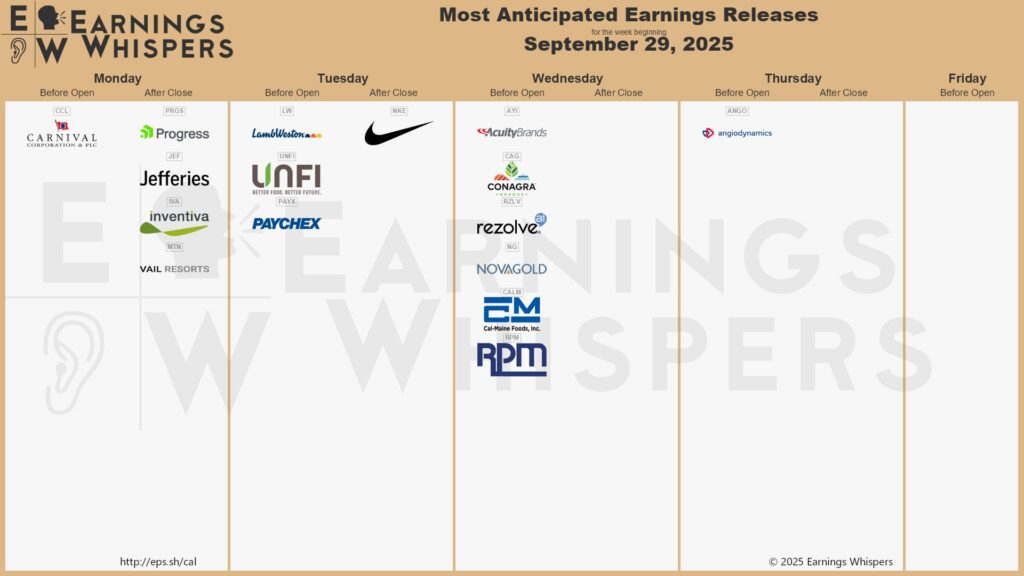
💼 While a few notable companies are still set to report this week, the next major wave of earnings begins in mid-October with Q3 results.
📅 Monday, Sep 29th
- Carnival Corporation (CCL): Carnival is set to report Q3 2025 earnings with consensus expectations pointing toward continued post-pandemic recovery momentum. Analysts are projecting earnings per share of $1.32 and revenue of approximately $8.10 billion, representing a 3.9% year-over-year increase in EPS and 2.5% revenue growth.
Market participants should focus on net yield performance, which increased by about 6.4% year over year in Q2 on a constant currency basis, highlighting Carnival’s pricing power in a competitive market. Cost management will remain a key theme, with adjusted cruise costs excluding fuel per ALBD (Available Lower Berth Day) projected to rise roughly 7% year over year in Q3, reflecting higher expenses from increased advertising investments. Occupancy reached 104% in Q2 and management noted that occupancy for the remainder of 2025 is expected to be the second-highest on record at historically strong prices. Supporting forward demand, customer deposits climbed to a record $8.5 billion in Q2.
📅 Tuesday, Sep 30th
- Nike, Inc. (NKE): Nike is scheduled to report its first quarter fiscal 2026 earnings, with Wall Street anticipating significant year-over-year declines as the company navigates its “Win Now” strategic transformation. Market participants should watch gross margin, which Nike guided to decline by about 3.5%–4.25% year-over-year in Q1 FY26, including around 1% of pressure tied to new U.S. tariffs. On the top line, analysts and commentators point to mid-single-digit revenue declines, with China and North America remaining weak due to challenging consumer conditions and heightened competition.
Attention will also be on management’s progress with its “Win Now” strategy, particularly signs of recovery in wholesale partnerships. To mitigate tariffs, Nike plans to cut the China share of U.S. footwear imports from roughly 16% to high single digits by May 2026, paired with phased price adjustments and sourcing shifts, with the tariff headwind estimated at about $1 billion under current policy.
- Paychex, Inc. (PAYX): Paychex will report its first-quarter fiscal 2026 results, with analysts expecting $1.20 per share in earnings (up 3.4% year-over-year) and $1.54 billion in revenue (representing 16.6% growth). Management Solutions, a core segment of the company, is projected for strong growth for the full fiscal year 2026, with company guidance of about 20–22%. Growth will be supported by the closed $4.1B Paycor acquisition and higher revenue per client from price realization and product penetration.
PEO & Insurance Solutions, another segment of the company, is guided for 6–8% growth in FY26, with performance tied to worksite employee trends. Key items to watch include client retention at roughly 82–83%, revenue per client, and synergy capture, as management has raised expected Paycor cost synergies to about $90M for FY26 from more than $80M initially.
📅 Wednesday, Oct 1st
- ConAgra Brands, Inc. (CAG): Conagra Brands will report Q1 fiscal 2026 results with adjusted EPS estimated at $0.33 versus $0.53 a year ago and revenue forecast at $2.62 billion, marking a 6.1% year-over-year decline. Market participants should monitor margins, as Conagra’s most recent quarter saw gross margin contract by 228 basis points to 25.4%, reflecting cost inflation and negative operating leverage.
For FY26, the company guided to organic net sales growth of –1% to +1% and adjusted EPS of $1.70 to $1.85, signaling cautious expectations amid ongoing cost pressures. Management emphasized cost discipline and supply chain resiliency initiatives as key levers to offset inflationary headwinds. Investors will also be watching for updates on volume trends, international performance, and any adjustments to the full-year outlook, which will provide signals on Conagra’s ability to stabilize margins under a challenging macro backdrop.
We hope this helps and happy trading!
– Trade and Travel Team
Related Blogs


Follow Us
Testimonials
Hear from students on why they chose the Trade and Travel Family and how it has changed their lives.

